Gartley Fibonacci pattern identified at 12/19 14:30. This pattern is still in the process of forming. Possible bearish price movement towards target levels ranging from 238.54 to 203.78 within the next 12 days.
Target: 294.78 Entry: Stop: 249.28


Gartley Fibonacci pattern identified at 12/19 14:30. This pattern is still in the process of forming. Possible bearish price movement towards target levels ranging from 238.54 to 203.78 within the next 12 days.
Target: 294.78 Entry: Stop: 249.28
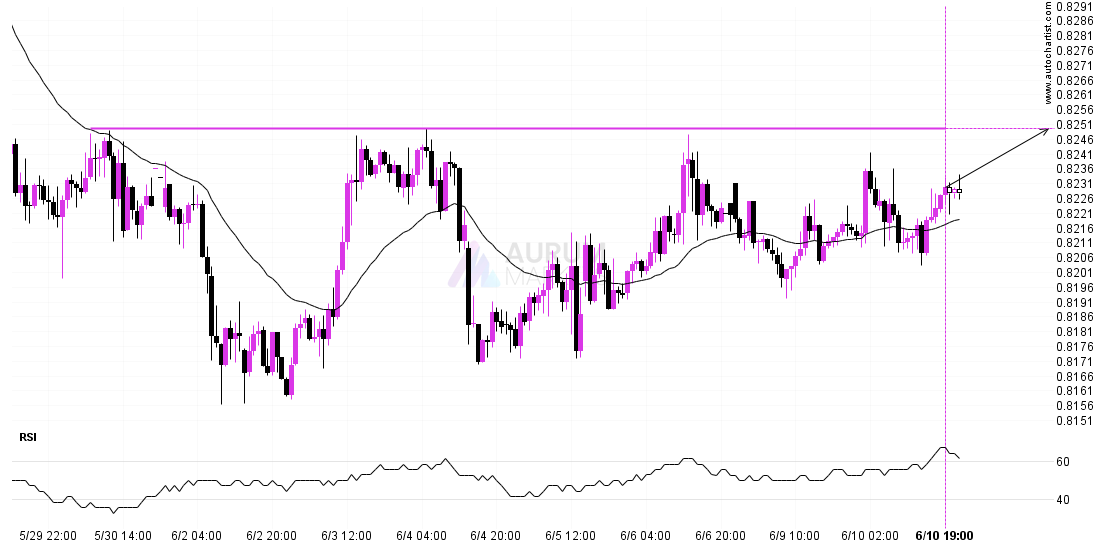
USDCHF is heading towards 0.8250 and could reach this point within the next 2 days. It has tested this line numerous times in the past, and this time could be
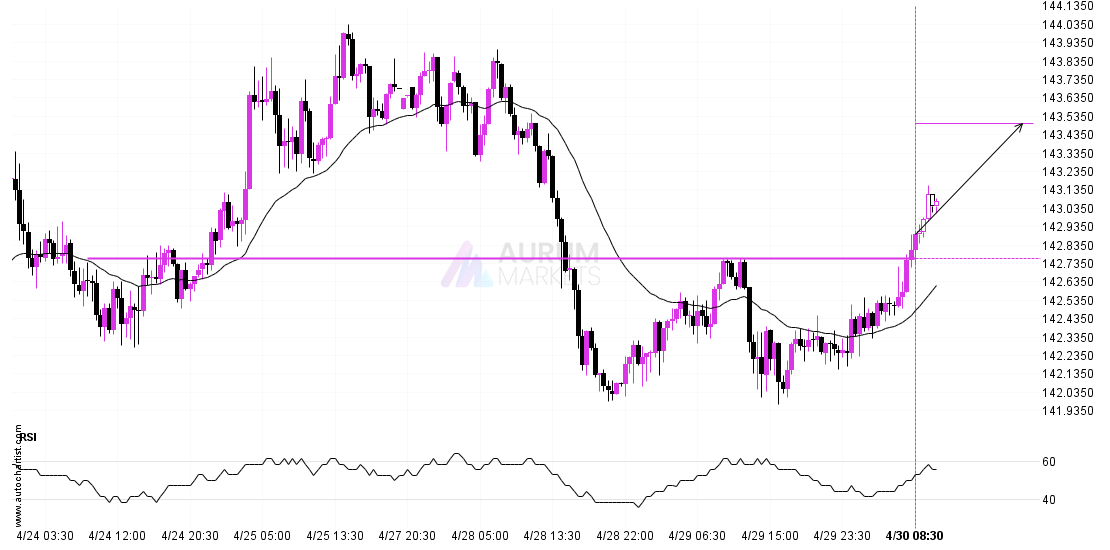
A strong resistance level has been breached at 142.7600 on the 30 Minutes USDJPY chart. Technical Analysis theory forecasts a movement to 143.4939 in the next 21 hours. Supported by
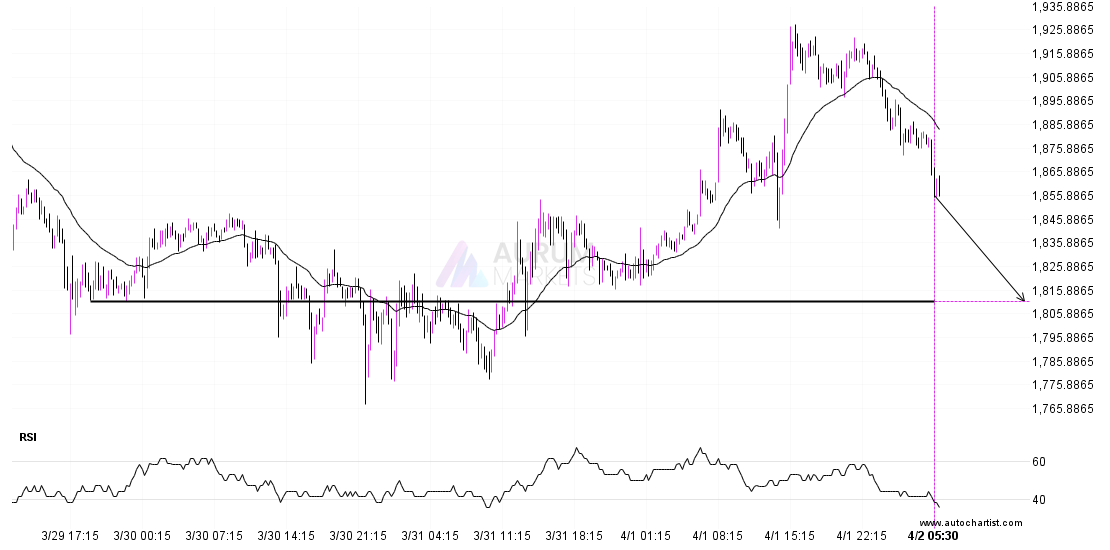
ETHUSD is moving towards a line of 1811.0699 which it has tested numerous times in the past. We have seen it retrace from this position in the past, so at