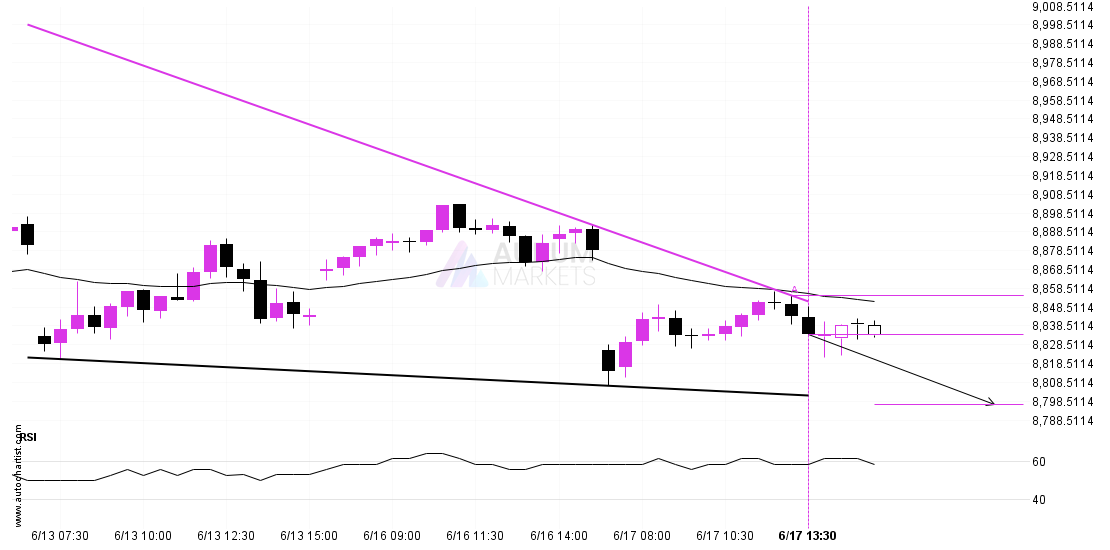
FTSE 100 is heading towards the support line of a Falling Wedge and could reach this point within the next 5 hours. It has tested this line numerous times in the past, and this time could be no different from the past, ending in a rebound instead of a breakout. If the breakout doesn’t happen, we could see a retracement back down to current levels.
Supported by Downward sloping Moving Average
Target: 8797.0111 Entry: 8833.72 Stop: 8854.69