ABCD Fibonacci pattern identified at 9/30 00:00. This pattern is still in the process of forming. Possible bearish price movement towards target levels ranging from 0.6701 to 0.6340 within the next 11 days.
Target: 0.7286 Entry: Stop: 0.6813


ABCD Fibonacci pattern identified at 9/30 00:00. This pattern is still in the process of forming. Possible bearish price movement towards target levels ranging from 0.6701 to 0.6340 within the next 11 days.
Target: 0.7286 Entry: Stop: 0.6813
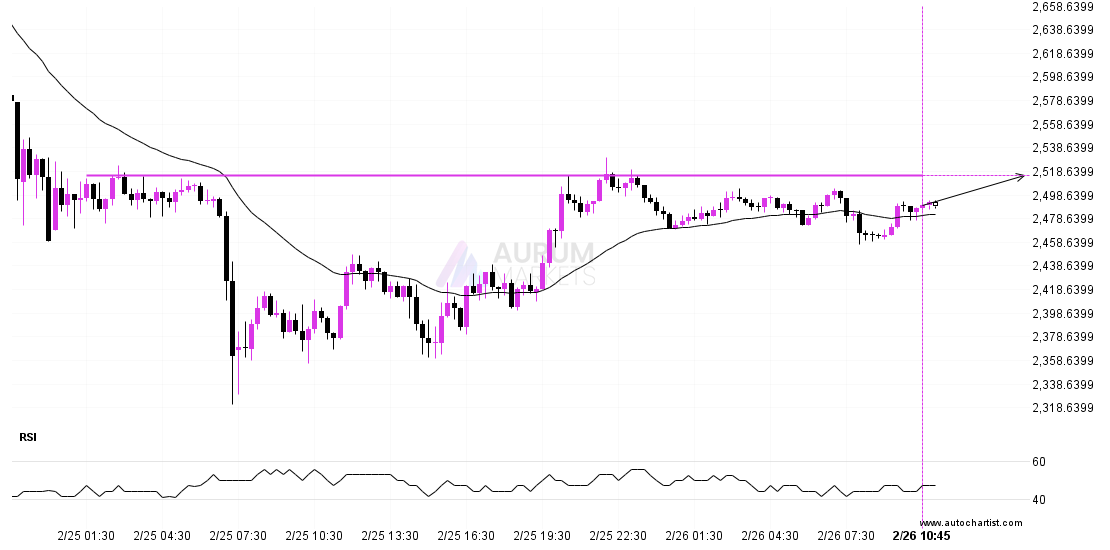
The movement of ETHUSD towards 2514.8000 price line is yet another test of the line it reached numerous times in the past. We could expect this test to happen in

An emerging Channel Down has been detected on USDCAD on the 1 hour chart. There is a possible move towards 1.3819 next few candles. Once reaching resistance it may continue
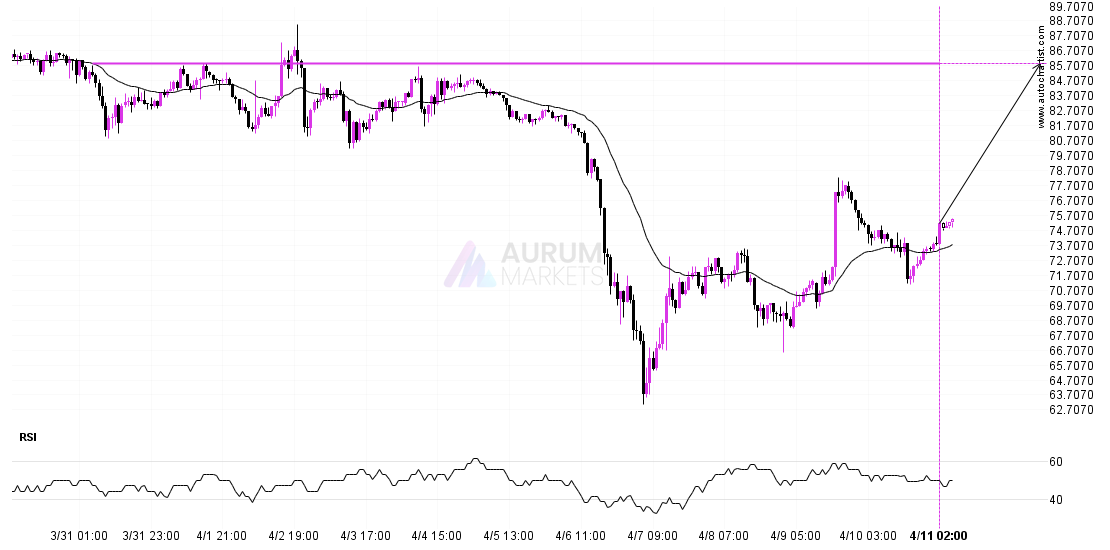
The price of LTCUSD in heading back to the resistance area. It is possible that it will struggle to break through it and move back in the other direction. The