ABCD Fibonacci pattern identified at 10/3 21:30. This pattern is still in the process of forming. Possible bearish price movement towards target levels ranging from 520.23 to 501.19 within the next 10 hours.
Target: 551.03 Entry: Stop: 526.11


ABCD Fibonacci pattern identified at 10/3 21:30. This pattern is still in the process of forming. Possible bearish price movement towards target levels ranging from 520.23 to 501.19 within the next 10 hours.
Target: 551.03 Entry: Stop: 526.11

Approaching Support level of 1.3804 identified at 9/5 20:45. This pattern is still in the process of forming. Possible bearish price movement towards the support 1.3804 within the next 8
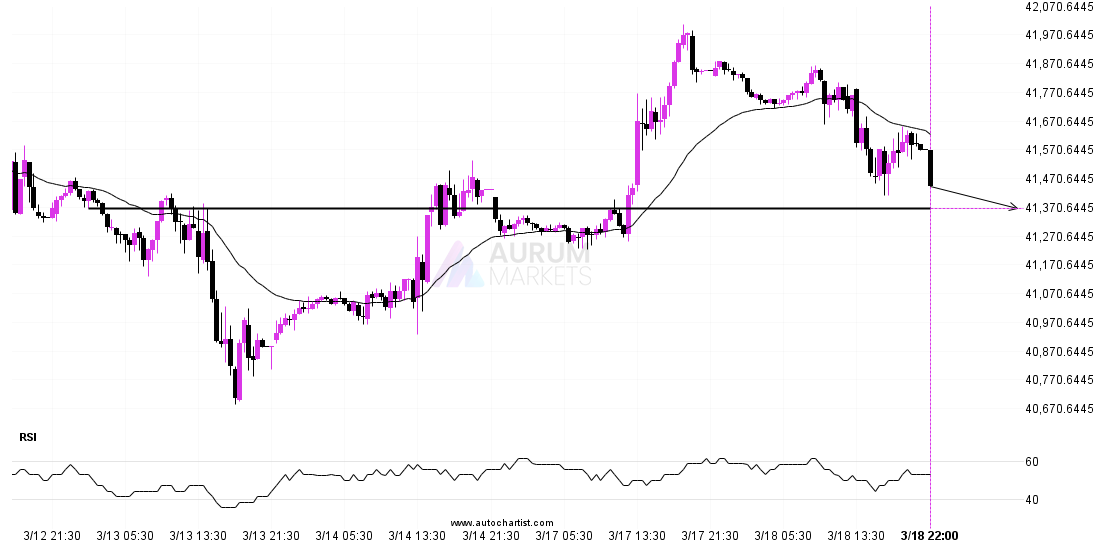
A strong support level has been identified at 41365.8906 on the 30 Minutes DOW 30 chart. DOW 30 is likely to test it soon. Supported by Downward sloping Moving Average

Approaching Support level of 198.62 identified at 9/8 08:00. This pattern is still in the process of forming. Possible bearish price movement towards the support 198.62 within the next 1