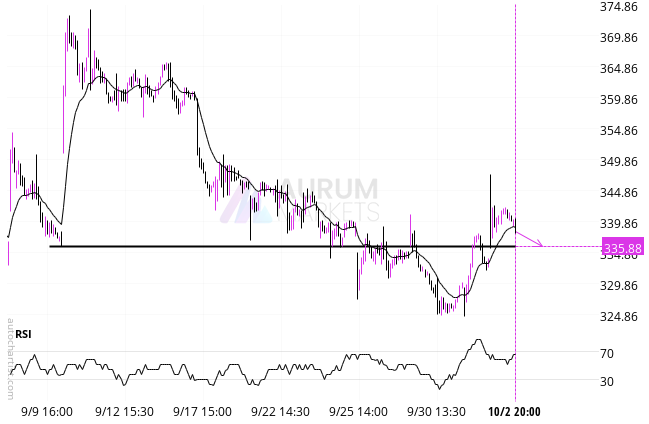
Butterfly Fibonacci pattern identified at 10/1 13:30. This pattern is still in the process of forming. Possible bearish price movement towards target levels ranging from 354.12 to 314.96 within the next 20 days.Butterfly Fibonacci pattern identified at 10/1 13:30. This pattern is still in the process of forming. Possible bearish price movement towards target levels ranging from 354.12 to 314.96 within the next 20 days.
Butterfly Fibonacci pattern identified at 10/1 13:30. This pattern is still in the process of forming. Possible bearish price movement towards target levels ranging from 354.12 to 314.96 within the