FTSE 100 approaching important level of 8510.9004FTSE 100 approaching important level of 8510.9004
FTSE 100 is en route to a very important line that will be a definite deciding factor of what is to come! We may see this trajectory continue to touch


FTSE 100 is en route to a very important line that will be a definite deciding factor of what is to come! We may see this trajectory continue to touch
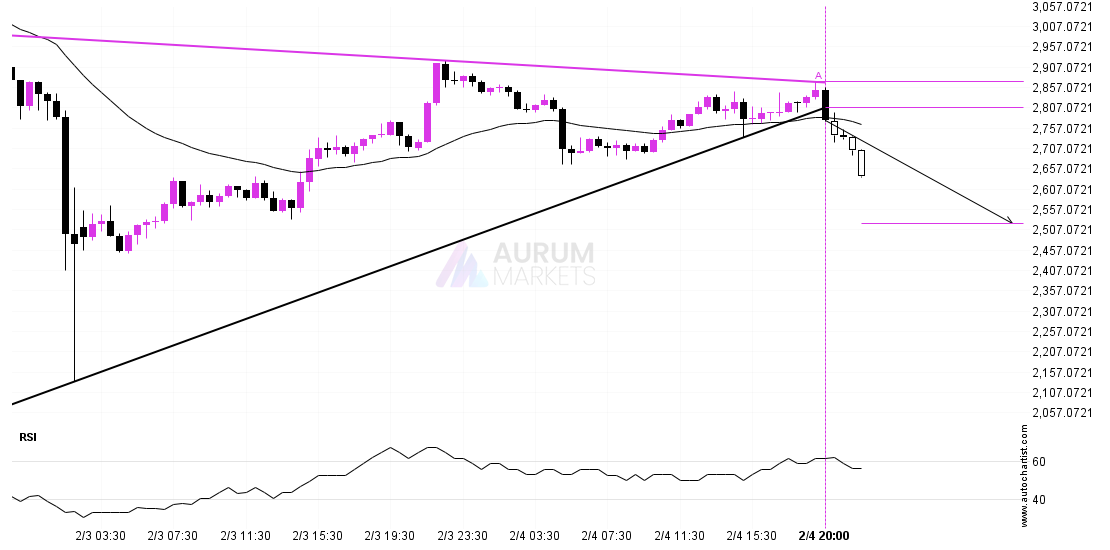
ETHUSD moved through the support line of a Triangle at 2806.8060810810807 on the 30 Minutes chart. This line has been tested a number of times in the past and this
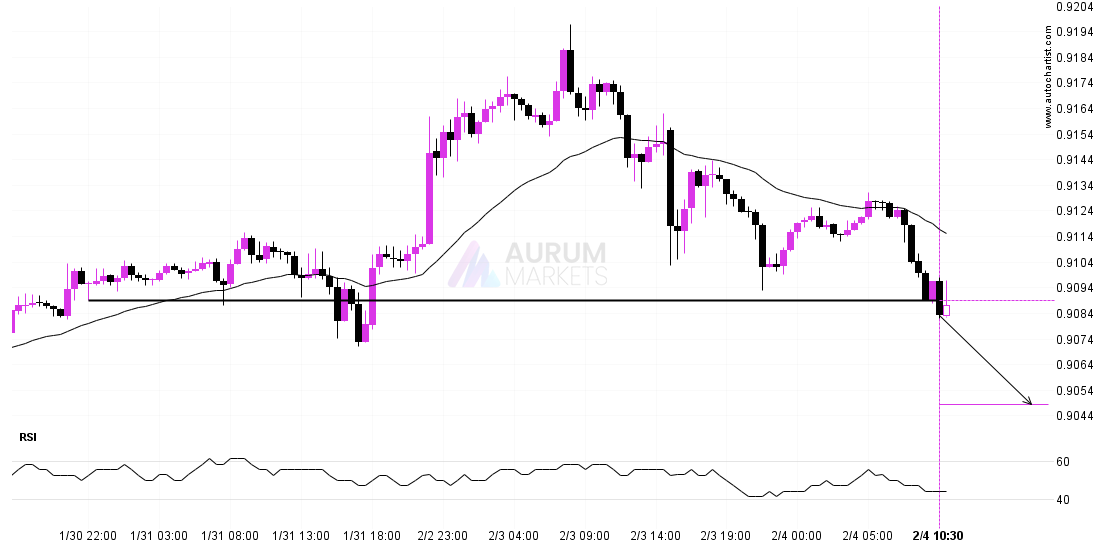
USDCHF has broken through a line of 0.9089 and suggests a possible movement to 0.9049 within the next 14 hours. It has tested this line numerous times in the past,
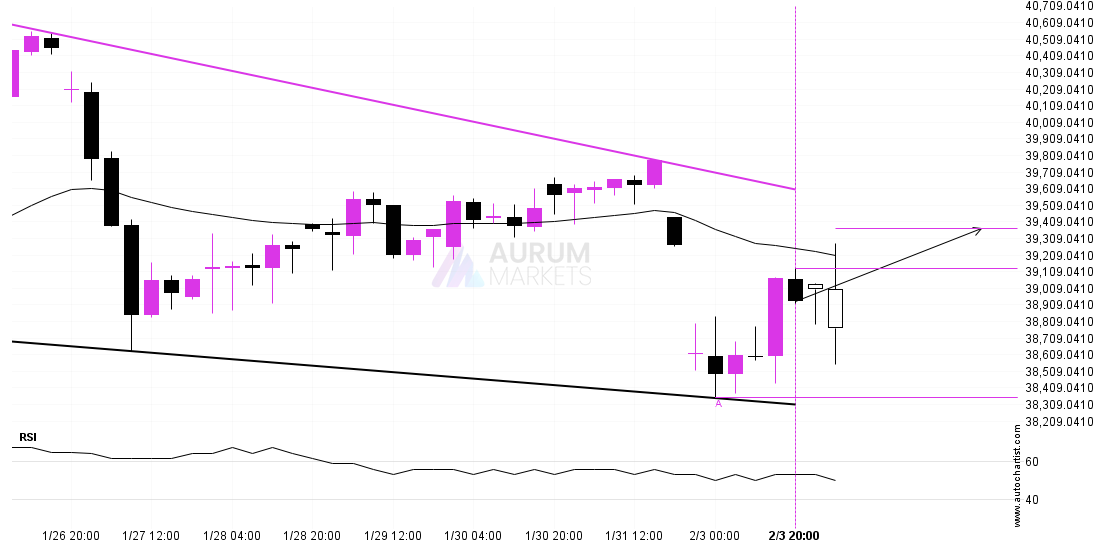
Nikkei 225 was identified at around 39125.0 having recently rebounded of the support on the 4 hour data interval. Ultimately, the price action of the stock has formed a Falling
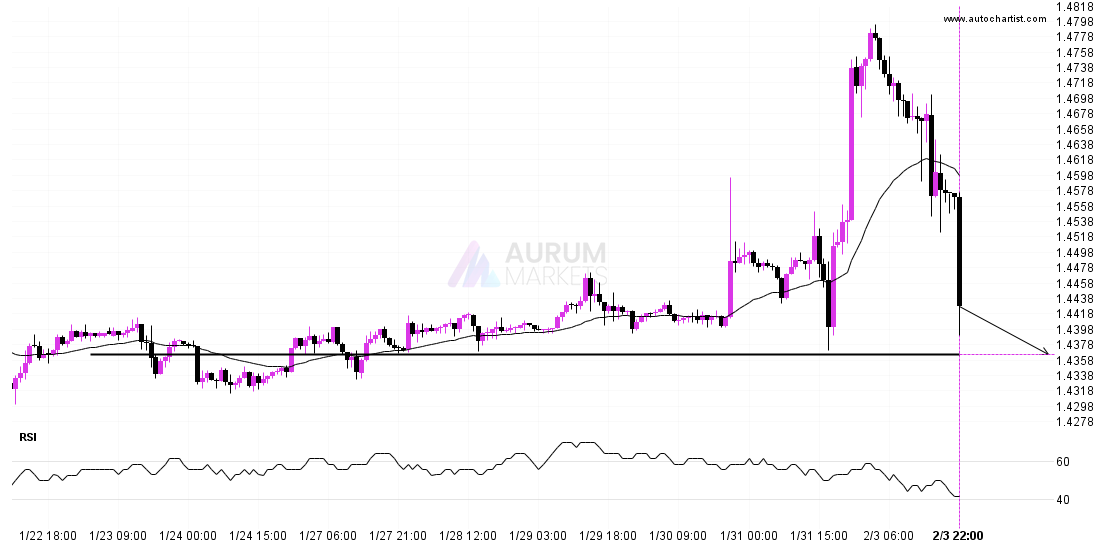
USDCAD is approaching a support line at 1.4366. If it hits the support line, it may break through this level to continue the bearish trend, or it may turn around
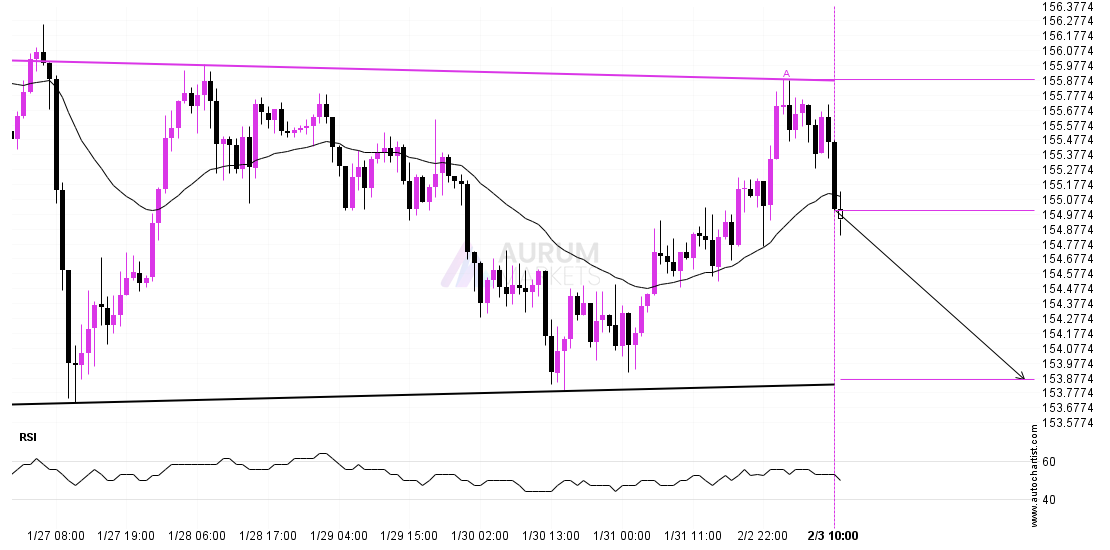
Emerging Rectangle pattern in its final wave was identified on the USDJPY 1 hour chart. After a strong bearish run, we find USDJPY heading towards the upper triangle line with
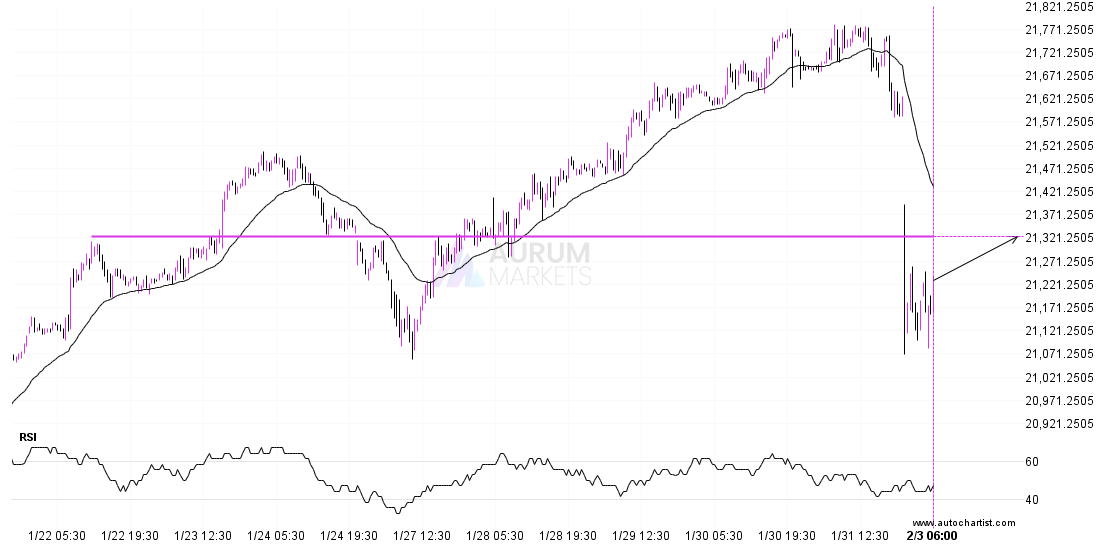
DAX 40 is about to retest a key horizontal resistance level near 21324.8008. It has tested this level 4 times in the recent past and could simply bounce off like
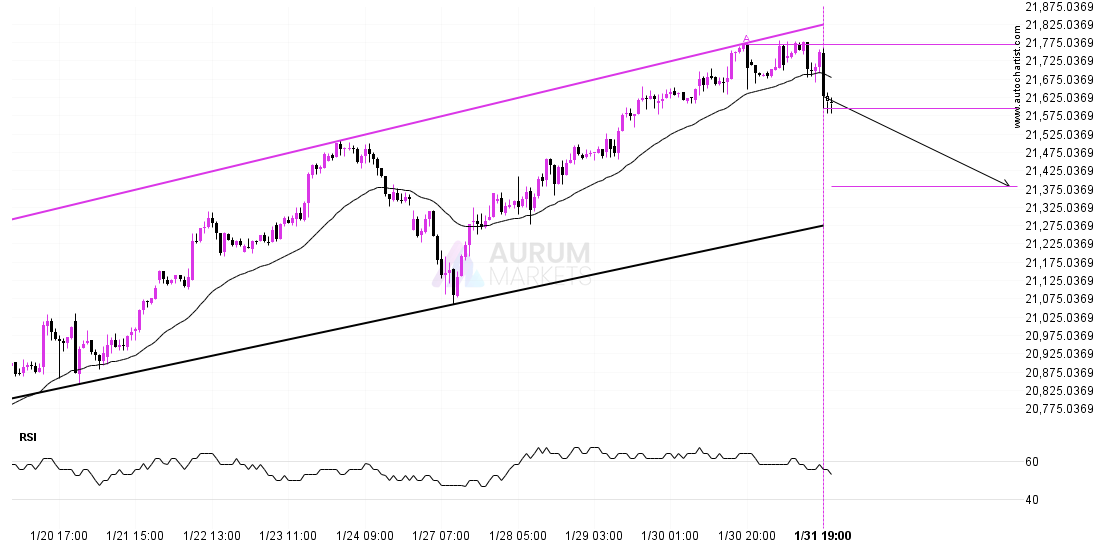
DAX 40 is heading towards the support line of a Channel Up and could reach this point within the next 3 days. It has tested this line numerous times in
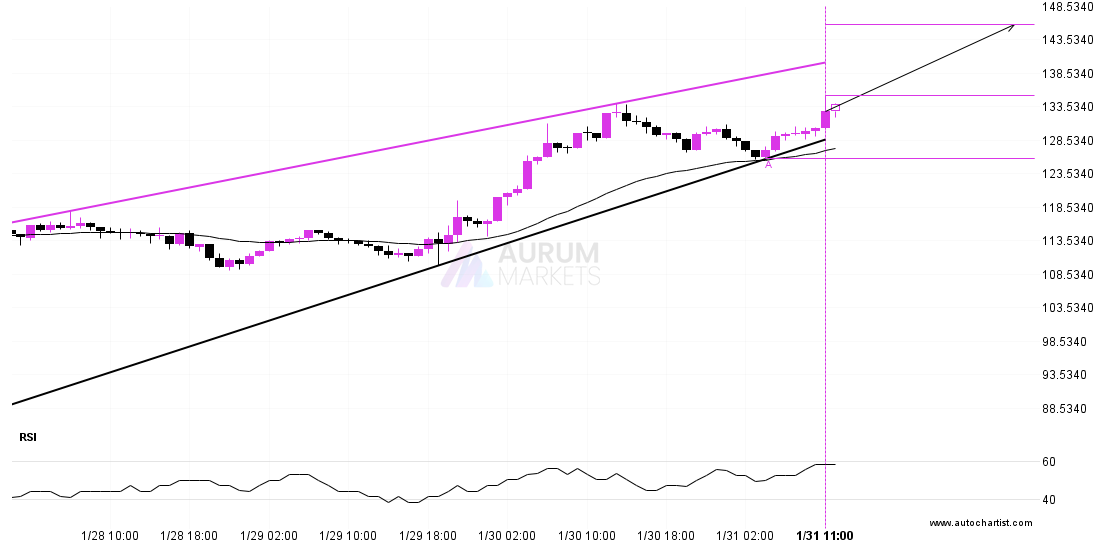
A Rising Wedge pattern was identified on LTCUSD at 135.25, creating an expectation that it may move to the resistance line at 145.7082. It may break through that line and
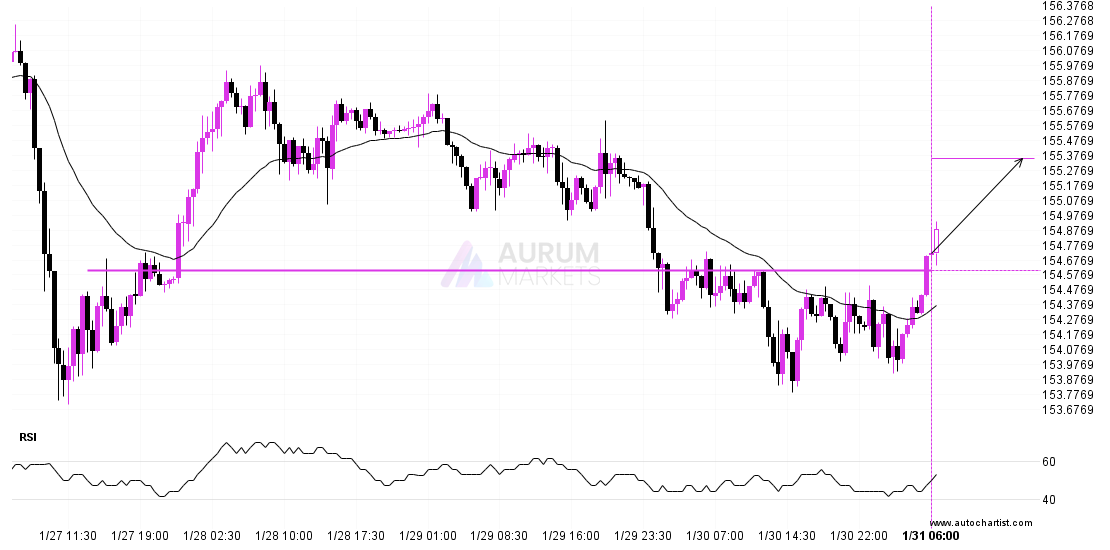
A strong resistance level has been breached at 154.6040 on the 30 Minutes USDJPY chart. Technical Analysis theory forecasts a movement to 155.3544 in the next 21 hours. Supported by