Skip to contentSkip to content
Aurum Markets Blog
  • Home
  • Technical Analysis
  • Market Insights
  • Client & IB Login
  • Register
Close Button

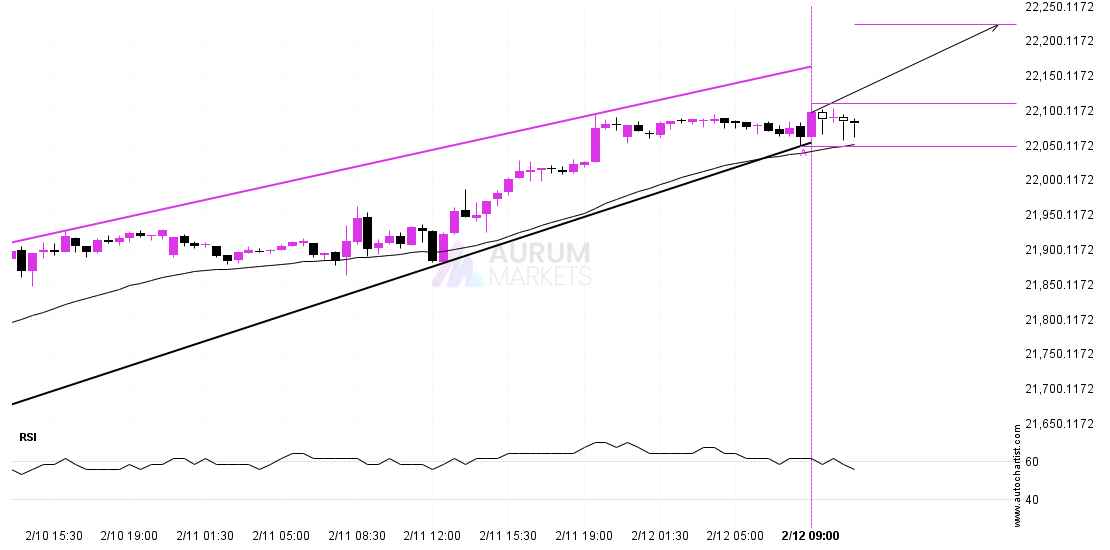
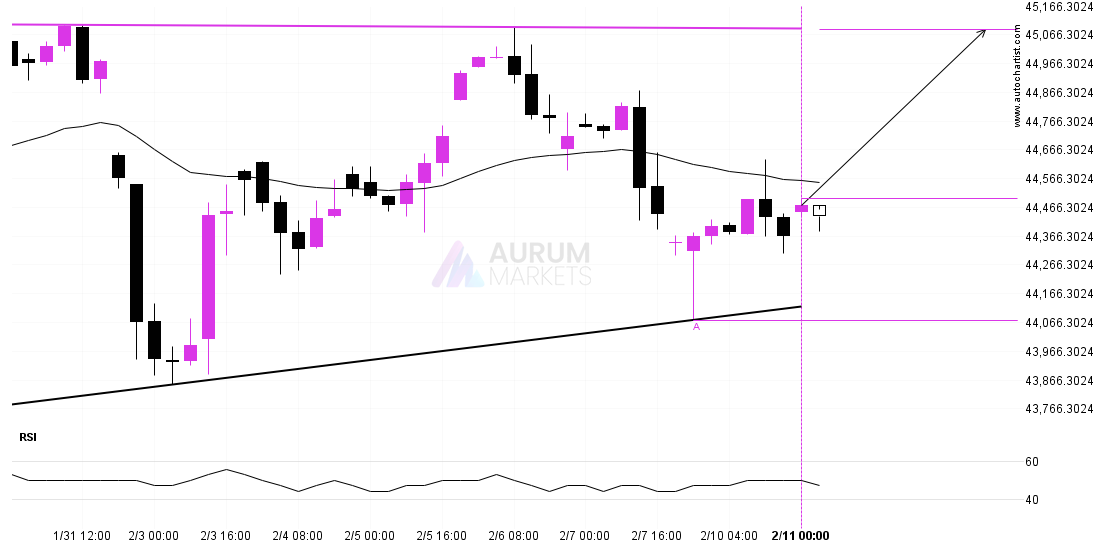
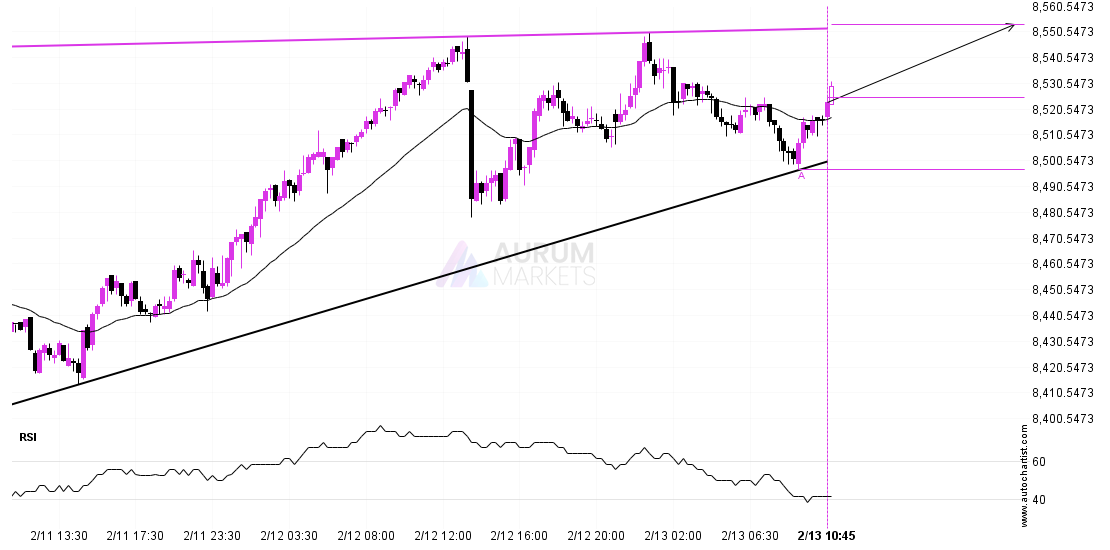
A potential bullish movement on ASX 225A potential bullish movement on ASX 225

February 13, 2025February 13, 2025| admin-aurumadmin-aurum| 0 Comment| 11:16 am

ASX 225 was identified at around 8525.2 having recently rebounded of the support on the 15 Minutes data interval. Ultimately, the price action of the stock has formed a Ascending

Read MoreRead More

USDCHF approaching important level of 0.9090USDCHF approaching important level of 0.9090

February 13, 2025February 13, 2025| admin-aurumadmin-aurum| 0 Comment| 7:35 am

USDCHF is approaching a support line at 0.9090. If it hits the support line, it may break through this level to continue the bearish trend, or it may turn around

Read MoreRead More

Channel Down breakout on BTCUSDChannel Down breakout on BTCUSD

February 13, 2025February 13, 2025| admin-aurumadmin-aurum| 0 Comment| 6:14 am

BTCUSD has broken through a resistance line. It has touched this line at least twice in the last 11 days. This breakout may indicate a potential move to 99541.1854 within

Read MoreRead More

USDCAD approaches important level of 1.4345USDCAD approaches important level of 1.4345

February 12, 2025February 12, 2025| admin-aurumadmin-aurum| 0 Comment| 10:16 pm

USDCAD is moving towards a line of 1.4345 which it has tested numerous times in the past. We have seen it retrace from this position in the past, so at

Read MoreRead More

Either a rebound or a breakout imminent on DAX 40Either a rebound or a breakout imminent on DAX 40

February 12, 2025February 12, 2025| admin-aurumadmin-aurum| 0 Comment| 11:15 am

A Rising Wedge pattern was identified on DAX 40 at 22110.5, creating an expectation that it may move to the resistance line at 22222.8663. It may break through that line

Read MoreRead More

Should we expect a bearish trend on LTCUSD?Should we expect a bearish trend on LTCUSD?

February 12, 2025February 12, 2025| admin-aurumadmin-aurum| 0 Comment| 6:16 am

A strong support level has been breached at 117.1600 on the 15 Minutes LTCUSD chart. Technical Analysis theory forecasts a movement to 111.8460 in the next 8 hours. Supported by

Read MoreRead More

Confirmed breakout on ETHUSD 4 hour chartConfirmed breakout on ETHUSD 4 hour chart

February 11, 2025February 11, 2025| admin-aurumadmin-aurum| 0 Comment| 10:16 pm

ETHUSD has broken through the support line of a Triangle technical chart pattern. Because we have seen it retrace from this line in the past, one should wait for confirmation

Read MoreRead More

USDJPY approaching resistance levelUSDJPY approaching resistance level

February 11, 2025February 11, 2025| admin-aurumadmin-aurum| 0 Comment| 11:17 am

USDJPY is moving towards a key resistance level at 152.3030. This is a previously tested level for USDJPY. This could be a good trading opportunity, either at the spot price,

Read MoreRead More

DOW 30 – getting close to resistance of a Ascending TriangleDOW 30 – getting close to resistance of a Ascending Triangle

February 11, 2025February 11, 2025| admin-aurumadmin-aurum| 0 Comment| 6:20 am

Emerging Ascending Triangle detected on DOW 30 – the pattern is an emerging one and has not yet broken through support, but the price is expected to move up over

Read MoreRead More

ETHUSD approaching support levelETHUSD approaching support level

February 10, 2025February 10, 2025| admin-aurumadmin-aurum| 0 Comment| 10:21 pm

ETHUSD is approaching a support line at 2650.1001. If it hits the support line, it may break through this level to continue the bearish trend, or it may turn around

Read MoreRead More

Posts pagination

Previous 1 … 51 52 53 … 55 Next

Recent Posts

  • 3 Point Extension Fibonacci pattern identified at 12/27 14:30. Possible bearish price movement towards target levels ranging from 454.50 to 311.16 within the next 10 days.
  • US30 Dow Jones Industrial Average Index is approaching an important level at 48456.12
  • A potential bearish move in FRA40 CAC 40 French Index
  • Trade outlook for EURAUD from 2025-12-22 05:00:00.000 until 2025-12-22 05:00:00.000
  • Gartley Fibonacci pattern identified at 12/19 14:30. This pattern is still in the process of forming. Possible bearish price movement towards target levels ranging from 238.54 to 203.78 within the next 12 days.

Recent Comments

No comments to show.
  • Technical Analysis

Search

Archives

  • December 2025
  • November 2025
  • October 2025
  • September 2025
  • August 2025
  • July 2025
  • June 2025
  • May 2025
  • April 2025
  • March 2025
  • February 2025
  • January 2025

Meta

  • Register
  • Log in

Categories

  • Technical Analysis

Educational Landing Page WordPress Theme Copyright @ 2025 Aurum Markets Limited

Back To Top