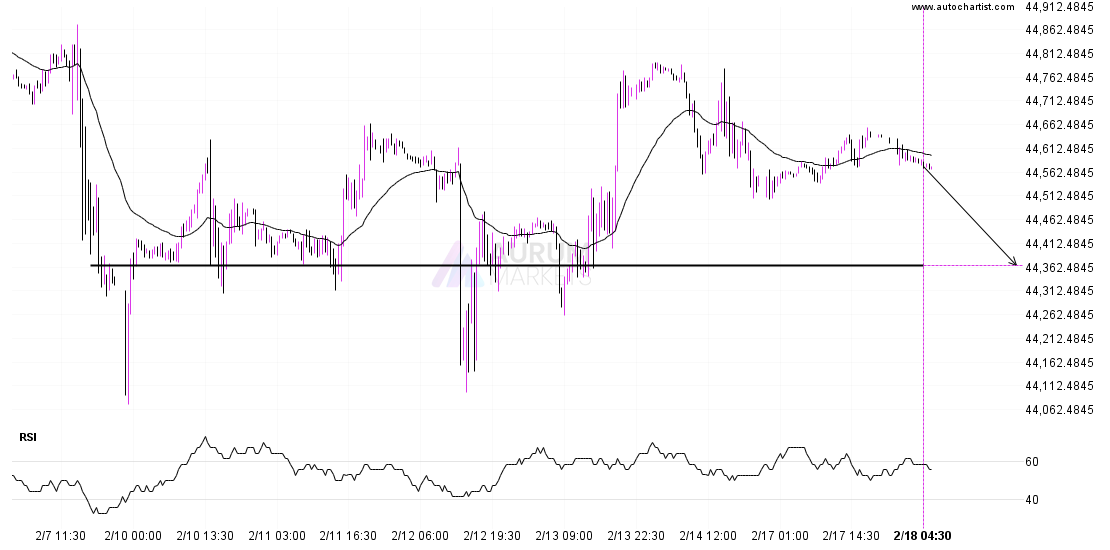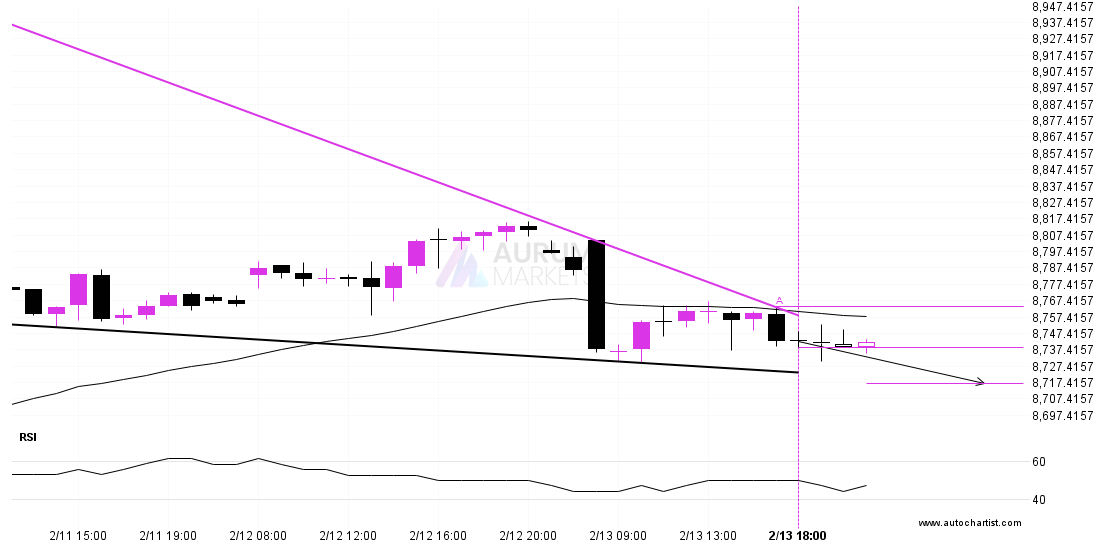
Either a rebound or a breakout imminent on FTSE 100Either a rebound or a breakout imminent on FTSE 100
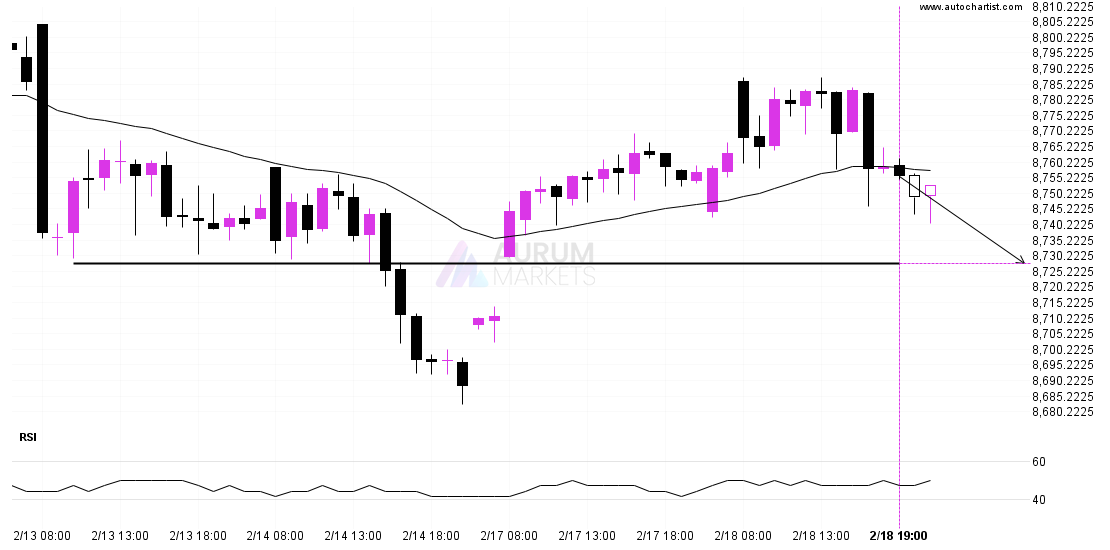
The movement of FTSE 100 towards 8727.8203 price line is yet another test of the line it reached numerous times in the past. We could expect this test to happen