Skip to contentSkip to content
Aurum Markets Blog
  • Home
  • Technical Analysis
  • Market Insights
  • Client & IB Login
  • Register
Close Button

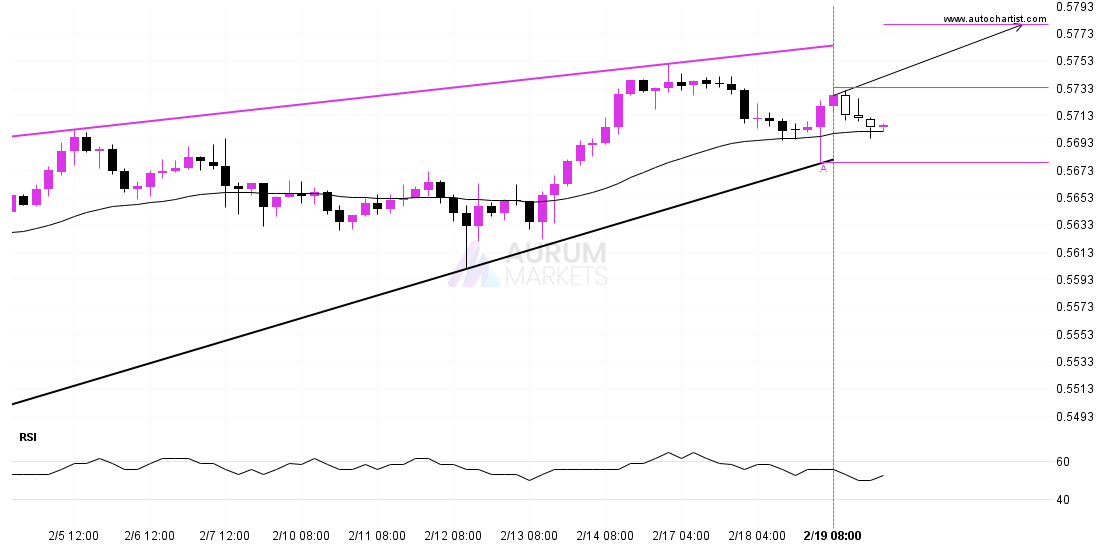
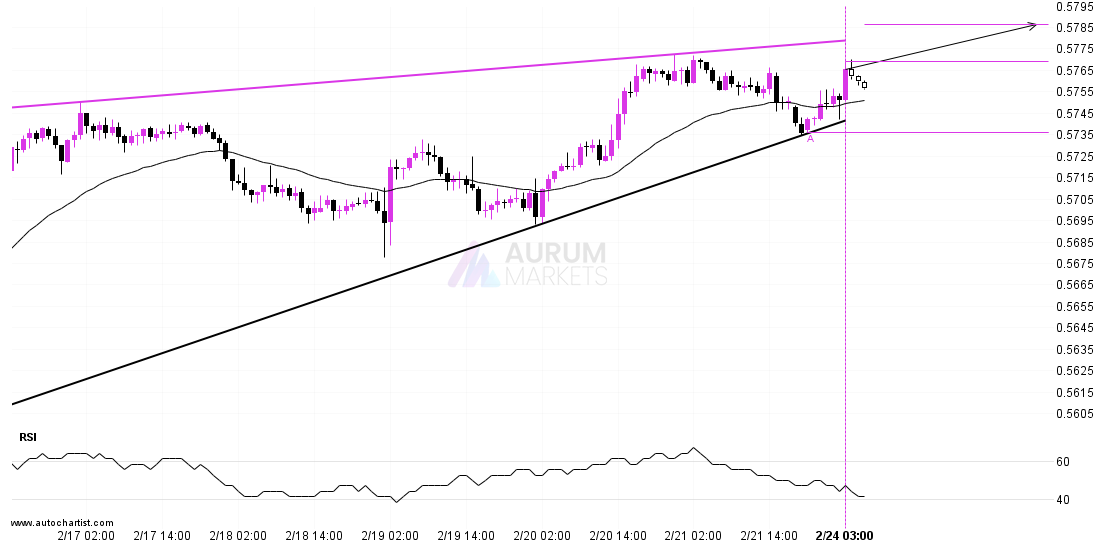
NZDUSD – getting close to resistance of a Rising WedgeNZDUSD – getting close to resistance of a Rising Wedge

February 24, 2025February 24, 2025| admin-aurumadmin-aurum| 0 Comment| 6:18 am

A Rising Wedge pattern was identified on NZDUSD at 0.57691, creating an expectation that it may move to the resistance line at 0.5786. It may break through that line and

Read MoreRead More

FTSE 100 broke through important 8626.5000 price lineFTSE 100 broke through important 8626.5000 price line

February 23, 2025February 23, 2025| admin-aurumadmin-aurum| 0 Comment| 10:15 pm

FTSE 100 is once again retesting a key horizontal support level at 8626.5000. It has tested this level 3 times in the recent past and could simply bounce off like

Read MoreRead More

Should we expect a bullish trend on ETHUSD?Should we expect a bullish trend on ETHUSD?

February 21, 2025February 21, 2025| admin-aurumadmin-aurum| 0 Comment| 11:16 am

ETHUSD is once again retesting a key horizontal resistance level at 2778.1201. It has tested this level 3 times in the recent past and could simply bounce off like it

Read MoreRead More

A potential bullish movement on NZDUSDA potential bullish movement on NZDUSD

February 21, 2025February 21, 2025| admin-aurumadmin-aurum| 0 Comment| 6:16 am

NZDUSD is moving towards a resistance line which it has tested numerous times in the past. We have seen it retrace from this line before, so at this stage it

Read MoreRead More

FTSE 100 approaching important level of 8510.9004FTSE 100 approaching important level of 8510.9004

February 20, 2025February 20, 2025| admin-aurumadmin-aurum| 0 Comment| 10:16 pm

The movement of FTSE 100 towards 8510.9004 price line is yet another test of the line it reached numerous times in the past. We could expect this test to happen

Read MoreRead More

Should we expect a breakout or a rebound on USDJPY?Should we expect a breakout or a rebound on USDJPY?

February 20, 2025February 20, 2025| admin-aurumadmin-aurum| 0 Comment| 11:20 am

USDJPY is trapped in a Channel Down formation, implying that a breakout is Imminent. This is a great trade-setup for both trend and swing traders. It is now approaching a

Read MoreRead More

Should we expect a bearish trend on Nikkei 225?Should we expect a bearish trend on Nikkei 225?

February 20, 2025February 20, 2025| admin-aurumadmin-aurum| 0 Comment| 6:14 am

Nikkei 225 is once again retesting a key horizontal support level at 38760.0000. It has tested this level 6 times in the recent past and could simply bounce off like

Read MoreRead More

Should we expect a breakout or a rebound on NZDUSD?Should we expect a breakout or a rebound on NZDUSD?

February 19, 2025February 19, 2025| admin-aurumadmin-aurum| 0 Comment| 10:16 pm

NZDUSD is heading towards the resistance line of a Rising Wedge. If this movement continues, the price of NZDUSD could test 0.5779 within the next 3 days. It has tested

Read MoreRead More

Should we expect a breakout or a rebound on FTSE 100?Should we expect a breakout or a rebound on FTSE 100?

February 19, 2025February 19, 2025| admin-aurumadmin-aurum| 0 Comment| 11:15 am

FTSE 100 is approaching a support line at 8726.7002. If it hits the support line, it may break through this level to continue the bearish trend, or it may turn

Read MoreRead More

GBPUSD approaching support of a Channel UpGBPUSD approaching support of a Channel Up

February 19, 2025February 19, 2025| admin-aurumadmin-aurum| 0 Comment| 6:16 am

GBPUSD was identified at around 1.26075 having recently rebounded of the resistance on the 1 hour data interval. Ultimately, the price action of the stock has formed a Channel Up

Read MoreRead More

Posts pagination

Previous 1 … 49 50 51 … 55 Next

Recent Posts

  • 3 Point Extension Fibonacci pattern identified at 12/27 14:30. Possible bearish price movement towards target levels ranging from 454.50 to 311.16 within the next 10 days.
  • US30 Dow Jones Industrial Average Index is approaching an important level at 48456.12
  • A potential bearish move in FRA40 CAC 40 French Index
  • Trade outlook for EURAUD from 2025-12-22 05:00:00.000 until 2025-12-22 05:00:00.000
  • Gartley Fibonacci pattern identified at 12/19 14:30. This pattern is still in the process of forming. Possible bearish price movement towards target levels ranging from 238.54 to 203.78 within the next 12 days.

Recent Comments

No comments to show.
  • Technical Analysis

Search

Archives

  • December 2025
  • November 2025
  • October 2025
  • September 2025
  • August 2025
  • July 2025
  • June 2025
  • May 2025
  • April 2025
  • March 2025
  • February 2025
  • January 2025

Meta

  • Register
  • Log in

Categories

  • Technical Analysis

Educational Landing Page WordPress Theme Copyright @ 2025 Aurum Markets Limited

Back To Top