Skip to contentSkip to content
Aurum Markets Blog
  • Home
  • Technical Analysis
  • Market Insights
  • Client & IB Login
  • Register
Close Button

Possible breach of resistance level by EURUSDPossible breach of resistance level by EURUSD

February 27, 2025February 27, 2025| admin-aurumadmin-aurum| 0 Comment| 11:16 am

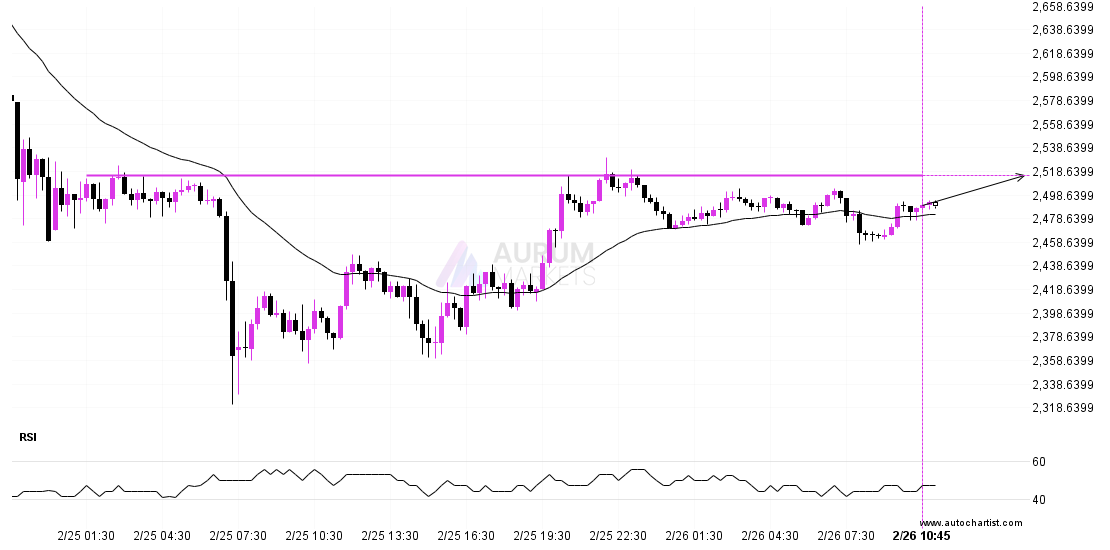
An emerging Ascending Triangle has been detected on EURUSD on the 30 Minutes chart. There is a possible move towards 1.0529 next few candles. Once reaching support it may continue

Read MoreRead More

Resistance breakout on USDCHFResistance breakout on USDCHF

February 27, 2025February 27, 2025| admin-aurumadmin-aurum| 0 Comment| 6:15 am

USDCHF has broken through a line of 0.8966 and suggests a possible movement to 0.8996 within the next 18 hours. It has tested this line numerous times in the past,

Read MoreRead More

A potential bearish movement on DAX 40A potential bearish movement on DAX 40

February 26, 2025February 26, 2025| admin-aurumadmin-aurum| 0 Comment| 10:16 pm

DAX 40 is heading towards the support line of a Channel Up and could reach this point within the next 16 hours. It has tested this line numerous times in

Read MoreRead More

Should we expect a breakout or a rebound on ETHUSD?Should we expect a breakout or a rebound on ETHUSD?

February 26, 2025February 26, 2025| admin-aurumadmin-aurum| 0 Comment| 11:21 am

The movement of ETHUSD towards 2514.8000 price line is yet another test of the line it reached numerous times in the past. We could expect this test to happen in

Read MoreRead More

Resistance line breached by DAX 40Resistance line breached by DAX 40

February 26, 2025February 26, 2025| admin-aurumadmin-aurum| 0 Comment| 6:13 am

DAX 40 has broken through a resistance line of a Ascending Triangle and suggests a possible movement to 22646.4403 within the next 2 days. It has tested this line in

Read MoreRead More

Either a rebound or a breakout imminent on FTSE 100Either a rebound or a breakout imminent on FTSE 100

February 25, 2025February 25, 2025| admin-aurumadmin-aurum| 0 Comment| 10:15 pm

FTSE 100 is heading towards 8510.9004 and could reach this point within the next 4 days. It has tested this line numerous times in the past, and this time could

Read MoreRead More

USDJPY – getting close to support of a Channel DownUSDJPY – getting close to support of a Channel Down

February 25, 2025February 25, 2025| admin-aurumadmin-aurum| 0 Comment| 11:17 am

Emerging Channel Down detected on USDJPY – the pattern is an emerging one and has not yet broken through resistance, but the price is expected to move up over the

Read MoreRead More

Possible start of a bearish trend on ETHUSDPossible start of a bearish trend on ETHUSD

February 25, 2025February 25, 2025| admin-aurumadmin-aurum| 0 Comment| 6:20 am

ETHUSD has broken through a support line. It has touched this line numerous times in the last 12 days. This breakout shows a potential move to 2443.7561 within the next

Read MoreRead More

GBPUSD approaching support of a Falling WedgeGBPUSD approaching support of a Falling Wedge

February 24, 2025February 24, 2025| admin-aurumadmin-aurum| 0 Comment| 10:21 pm

Emerging Falling Wedge detected on GBPUSD – the pattern is an emerging one and has not yet broken through resistance, but the price is expected to move up over the

Read MoreRead More

EURUSD approaching support levelEURUSD approaching support level

February 24, 2025February 24, 2025| admin-aurumadmin-aurum| 0 Comment| 11:16 am

A strong support level has been identified at 1.0447 on the 30 Minutes EURUSD chart. EURUSD is likely to test it soon. Supported by Downward sloping Moving Average Target: 1.0447

Read MoreRead More

Posts pagination

Previous 1 … 48 49 50 … 55 Next

Recent Posts

  • 3 Point Extension Fibonacci pattern identified at 12/27 14:30. Possible bearish price movement towards target levels ranging from 454.50 to 311.16 within the next 10 days.
  • US30 Dow Jones Industrial Average Index is approaching an important level at 48456.12
  • A potential bearish move in FRA40 CAC 40 French Index
  • Trade outlook for EURAUD from 2025-12-22 05:00:00.000 until 2025-12-22 05:00:00.000
  • Gartley Fibonacci pattern identified at 12/19 14:30. This pattern is still in the process of forming. Possible bearish price movement towards target levels ranging from 238.54 to 203.78 within the next 12 days.

Recent Comments

No comments to show.
  • Technical Analysis

Search

Archives

  • December 2025
  • November 2025
  • October 2025
  • September 2025
  • August 2025
  • July 2025
  • June 2025
  • May 2025
  • April 2025
  • March 2025
  • February 2025
  • January 2025

Meta

  • Register
  • Log in

Categories

  • Technical Analysis

Educational Landing Page WordPress Theme Copyright @ 2025 Aurum Markets Limited

Back To Top