Skip to contentSkip to content
Aurum Markets Blog
  • Home
  • Technical Analysis
  • Market Insights
  • Client & IB Login
  • Register
Close Button

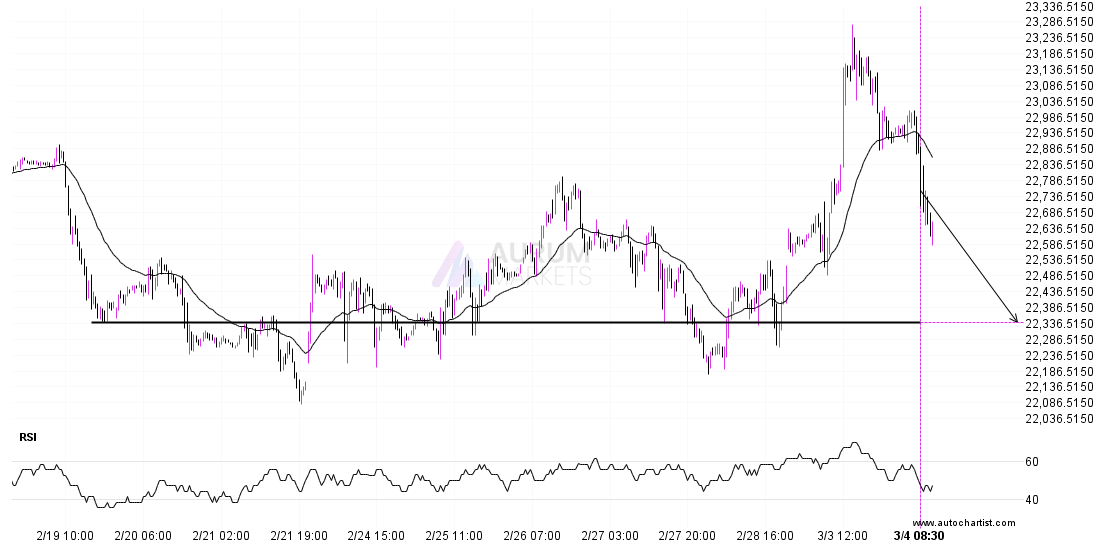
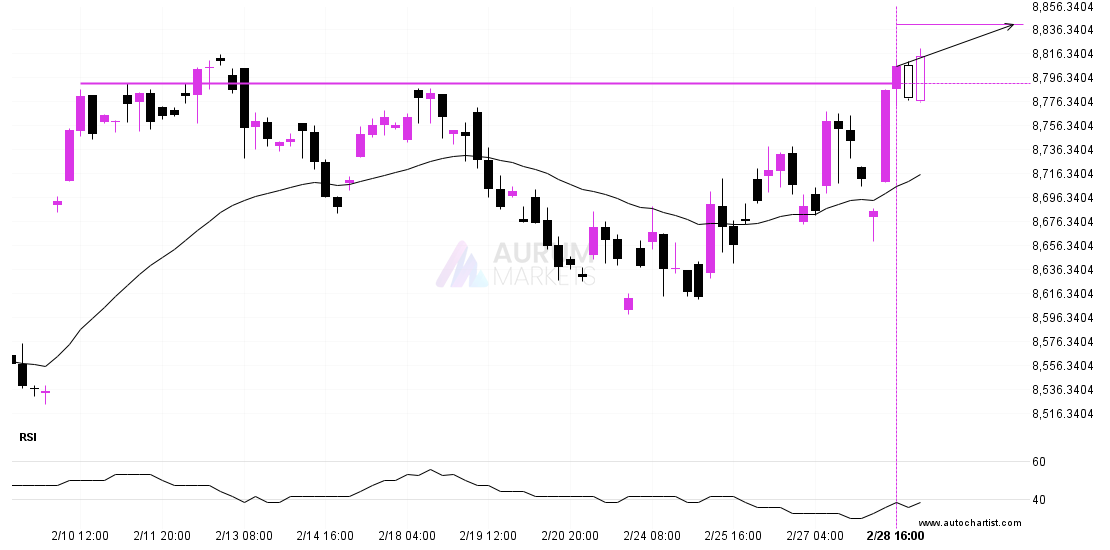
ETHUSD approaching resistance of a Falling WedgeETHUSD approaching resistance of a Falling Wedge

March 4, 2025March 4, 2025| admin-aurumadmin-aurum| 0 Comment| 10:15 pm

ETHUSD is approaching the resistance line of a Falling Wedge. It has touched this line numerous times in the last 12 days. If it tests this line again, it should

Read MoreRead More

DAX 40 – getting close to psychological price lineDAX 40 – getting close to psychological price line

March 4, 2025March 4, 2025| admin-aurumadmin-aurum| 0 Comment| 11:15 am

The price of DAX 40 in heading back to the support area. It is possible that it will struggle to break through it and move back in the other direction.

Read MoreRead More

AUDUSD – Continuation Chart Pattern – Falling WedgeAUDUSD – Continuation Chart Pattern – Falling Wedge

March 4, 2025March 4, 2025| admin-aurumadmin-aurum| 0 Comment| 6:15 am

Emerging Falling Wedge detected on AUDUSD – the pattern is an emerging one and has not yet broken through resistance, but the price is expected to move up over the

Read MoreRead More

Should we expect a breakout or a rebound on USDCAD?Should we expect a breakout or a rebound on USDCAD?

March 3, 2025March 3, 2025| admin-aurumadmin-aurum| 0 Comment| 10:15 pm

USDCAD is about to retest a key horizontal support level near 1.4429. It has tested this level 4 times in the recent past and could simply bounce off like it

Read MoreRead More

Should we expect a bearish trend on LTCUSD?Should we expect a bearish trend on LTCUSD?

March 3, 2025March 3, 2025| admin-aurumadmin-aurum| 0 Comment| 11:16 am

This trade setup on LTCUSD is formed by a period of consolidation; a period in which the price primarily moves sideways before choosing a new direction for the longer term.

Read MoreRead More

Important price line breached by FTSE 100Important price line breached by FTSE 100

March 3, 2025March 3, 2025| admin-aurumadmin-aurum| 0 Comment| 6:15 am

FTSE 100 has broken through a line of 8791.4502. If this breakout holds true, we could see the price of FTSE 100 heading towards 8840.5146 within the next 3 days.

Read MoreRead More

Confirmed breakout on DOW 30 4 hour chartConfirmed breakout on DOW 30 4 hour chart

March 2, 2025March 2, 2025| admin-aurumadmin-aurum| 0 Comment| 10:16 pm

The last 15 4 hour candles on DOW 30 formed a Falling Wedge pattern and broken out through the pattern lines, indicating a possible bullish movement towards the price level

Read MoreRead More

LTCUSD is on the approachLTCUSD is on the approach

February 28, 2025February 28, 2025| admin-aurumadmin-aurum| 0 Comment| 11:16 am

LTCUSD is approaching a resistance line at 130.9400. If it hits the resistance line, it may break through this level to continue the bullish trend, or it may turn around

Read MoreRead More

A potential bearish movement on BTCUSDA potential bearish movement on BTCUSD

February 28, 2025February 28, 2025| admin-aurumadmin-aurum| 0 Comment| 6:15 am

BTCUSD is moving towards a support line. Because we have seen it retrace from this line before, we could see either a break through this line, or a rebound back

Read MoreRead More

Possible start of a bullish trend as USDJPY breaks resistancePossible start of a bullish trend as USDJPY breaks resistance

February 27, 2025February 27, 2025| admin-aurumadmin-aurum| 0 Comment| 10:15 pm

USDJPY has broken through a resistance line. It has touched this line numerous times in the last 7 days. This breakout shows a potential move to 150.7258 within the next

Read MoreRead More

Posts pagination

Previous 1 … 47 48 49 … 55 Next

Recent Posts

  • 3 Point Extension Fibonacci pattern identified at 12/27 14:30. Possible bearish price movement towards target levels ranging from 454.50 to 311.16 within the next 10 days.
  • US30 Dow Jones Industrial Average Index is approaching an important level at 48456.12
  • A potential bearish move in FRA40 CAC 40 French Index
  • Trade outlook for EURAUD from 2025-12-22 05:00:00.000 until 2025-12-22 05:00:00.000
  • Gartley Fibonacci pattern identified at 12/19 14:30. This pattern is still in the process of forming. Possible bearish price movement towards target levels ranging from 238.54 to 203.78 within the next 12 days.

Recent Comments

No comments to show.
  • Technical Analysis

Search

Archives

  • December 2025
  • November 2025
  • October 2025
  • September 2025
  • August 2025
  • July 2025
  • June 2025
  • May 2025
  • April 2025
  • March 2025
  • February 2025
  • January 2025

Meta

  • Register
  • Log in

Categories

  • Technical Analysis

Educational Landing Page WordPress Theme Copyright @ 2025 Aurum Markets Limited

Back To Top