Skip to contentSkip to content
Aurum Markets Blog
  • Home
  • Technical Analysis
  • Market Insights
  • Client & IB Login
  • Register
Close Button

BTCUSD broke through important 84327.4375 price lineBTCUSD broke through important 84327.4375 price line

March 10, 2025March 10, 2025| admin-aurumadmin-aurum| 0 Comment| 6:18 am

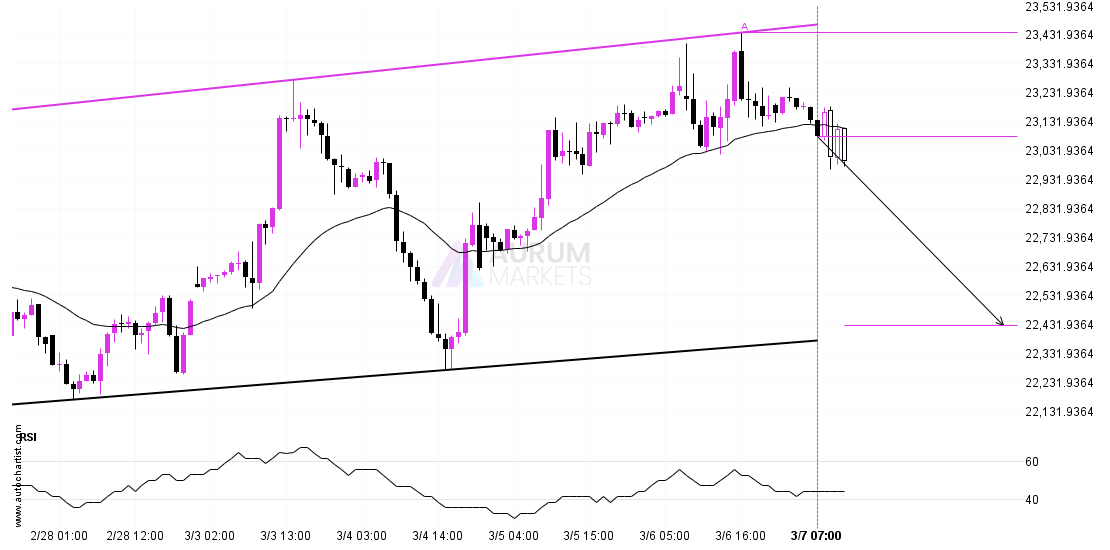
BTCUSD has broken through a support line. It has touched this line numerous times in the last 9 days. This breakout shows a potential move to 79226.7969 within the next

Read MoreRead More

Possibility of big movement expected on DOW 30Possibility of big movement expected on DOW 30

March 9, 2025March 9, 2025| admin-aurumadmin-aurum| 0 Comment| 10:16 pm

DOW 30 has broken through the resistance line which it has tested twice in the past. We have seen it retrace from this line before, so one should wait for

Read MoreRead More

A potential bearish movement on DAX 40A potential bearish movement on DAX 40

March 7, 2025March 7, 2025| admin-aurumadmin-aurum| 0 Comment| 11:14 am

A Channel Up pattern was identified on DAX 40 at 23083.0, creating an expectation that it may move to the support line at 22428.5727. It may break through that line

Read MoreRead More

Confirmed breakout on AUDUSD 1 hour chartConfirmed breakout on AUDUSD 1 hour chart

March 7, 2025March 7, 2025| admin-aurumadmin-aurum| 0 Comment| 6:21 am

AUDUSD has broken through 0.6320 which it has tested numerous times in the past. We have seen it retrace from this price in the past. If this new trend persists,

Read MoreRead More

Either a rebound or a breakout imminent on DOW 30Either a rebound or a breakout imminent on DOW 30

March 6, 2025March 6, 2025| admin-aurumadmin-aurum| 0 Comment| 10:17 pm

DOW 30 is heading towards the support line of a Falling Wedge and could reach this point within the next 2 days. It has tested this line numerous times in

Read MoreRead More

Should we expect a bearish trend on FTSE 100?Should we expect a bearish trend on FTSE 100?

March 6, 2025March 6, 2025| admin-aurumadmin-aurum| 0 Comment| 11:17 am

The breakout of FTSE 100 through the 8726.7002 price line is a breach of an important psychological price that is has tested numerous in the past. If this breakout persists,

Read MoreRead More

A potential bearish movement on USDJPYA potential bearish movement on USDJPY

March 6, 2025March 6, 2025| admin-aurumadmin-aurum| 0 Comment| 6:15 am

Emerging Falling Wedge pattern in its final wave was identified on the USDJPY 4 hour chart. After a strong bearish run, we find USDJPY heading towards the upper triangle line

Read MoreRead More

A potential bullish movement on ETHUSDA potential bullish movement on ETHUSD

March 5, 2025March 5, 2025| admin-aurumadmin-aurum| 0 Comment| 10:16 pm

The price of ETHUSD in heading back to the resistance area. It is possible that it will struggle to break through it and move back in the other direction. The

Read MoreRead More

Should we expect a breakout or a rebound on AUDUSD?Should we expect a breakout or a rebound on AUDUSD?

March 5, 2025March 5, 2025| admin-aurumadmin-aurum| 0 Comment| 11:17 am

Emerging Rising Wedge detected on AUDUSD – the pattern is an emerging one and has not yet broken through support, but the price is expected to move up over the

Read MoreRead More

A potential bullish movement on Nikkei 225A potential bullish movement on Nikkei 225

March 5, 2025March 5, 2025| admin-aurumadmin-aurum| 0 Comment| 6:15 am

Nikkei 225 is moving towards a key resistance level at 38220.0000. Nikkei 225 has previously tested this level 3 times and on each occasion it has bounced back off this

Read MoreRead More

Posts pagination

Previous 1 … 46 47 48 … 55 Next

Recent Posts

  • 3 Point Extension Fibonacci pattern identified at 12/27 14:30. Possible bearish price movement towards target levels ranging from 454.50 to 311.16 within the next 10 days.
  • US30 Dow Jones Industrial Average Index is approaching an important level at 48456.12
  • A potential bearish move in FRA40 CAC 40 French Index
  • Trade outlook for EURAUD from 2025-12-22 05:00:00.000 until 2025-12-22 05:00:00.000
  • Gartley Fibonacci pattern identified at 12/19 14:30. This pattern is still in the process of forming. Possible bearish price movement towards target levels ranging from 238.54 to 203.78 within the next 12 days.

Recent Comments

No comments to show.
  • Technical Analysis

Search

Archives

  • December 2025
  • November 2025
  • October 2025
  • September 2025
  • August 2025
  • July 2025
  • June 2025
  • May 2025
  • April 2025
  • March 2025
  • February 2025
  • January 2025

Meta

  • Register
  • Log in

Categories

  • Technical Analysis

Educational Landing Page WordPress Theme Copyright @ 2025 Aurum Markets Limited

Back To Top