LTCUSD is on the approachLTCUSD is on the approach
LTCUSD is moving towards a resistance line. Because we have seen it retrace from this level in the past, we could see either a break through this line, or a

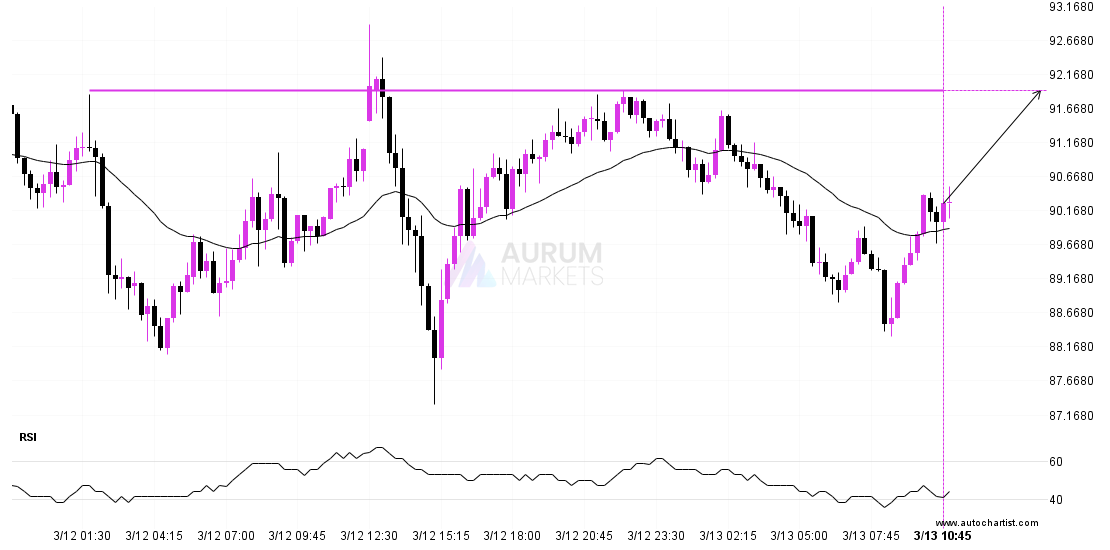
LTCUSD is moving towards a resistance line. Because we have seen it retrace from this level in the past, we could see either a break through this line, or a
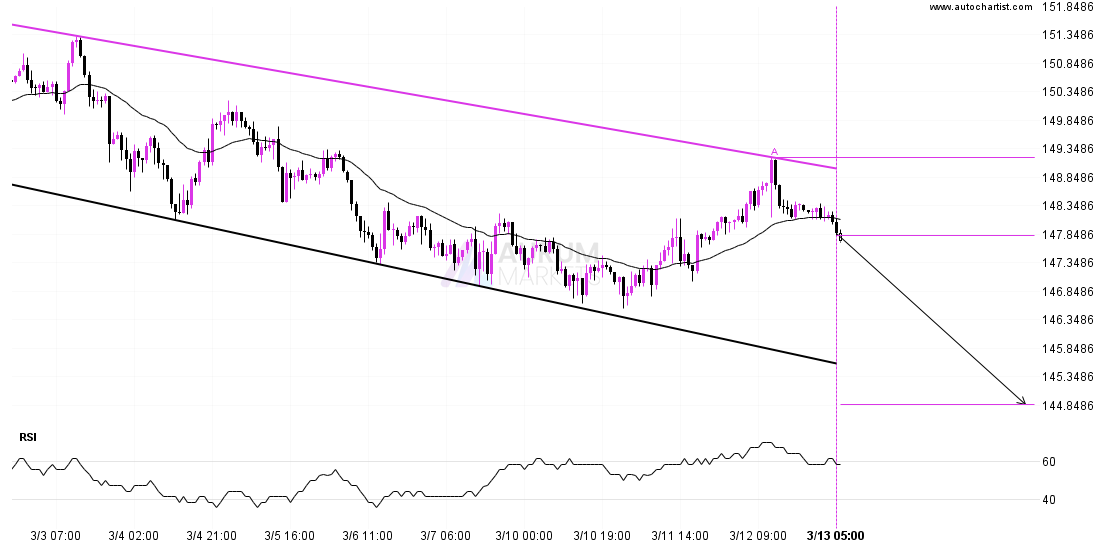
The movement of USDJPY towards the support line of a Channel Down is yet another test of the line it reached numerous times in the past. This line test could
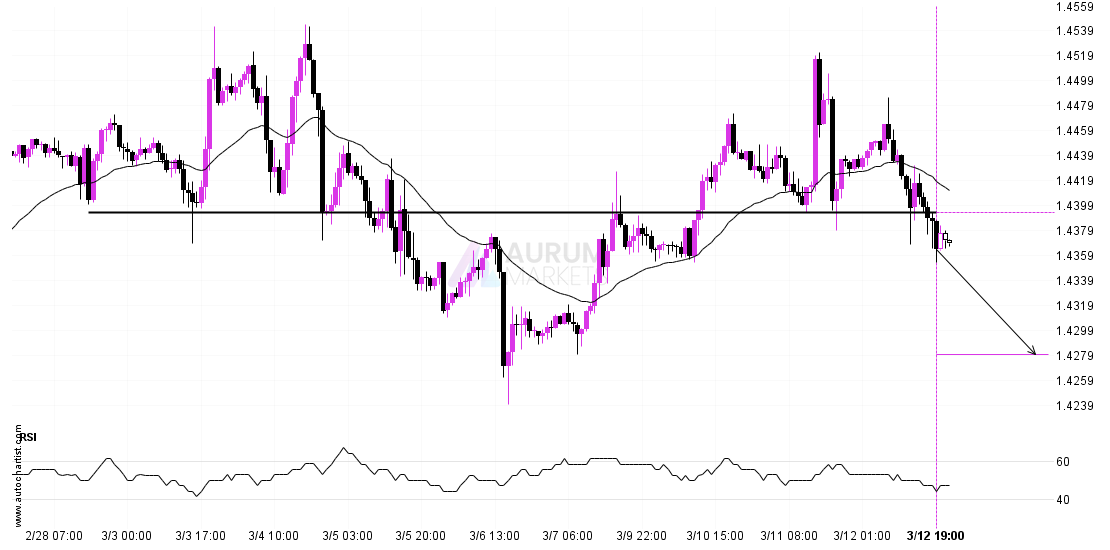
USDCAD has broken through a support line. It has touched this line numerous times in the last 13 days. This breakout shows a potential move to 1.4280 within the next
ASX 225 is moving towards a resistance line which it has tested numerous times in the past. We have seen it retrace from this line before, so at this stage
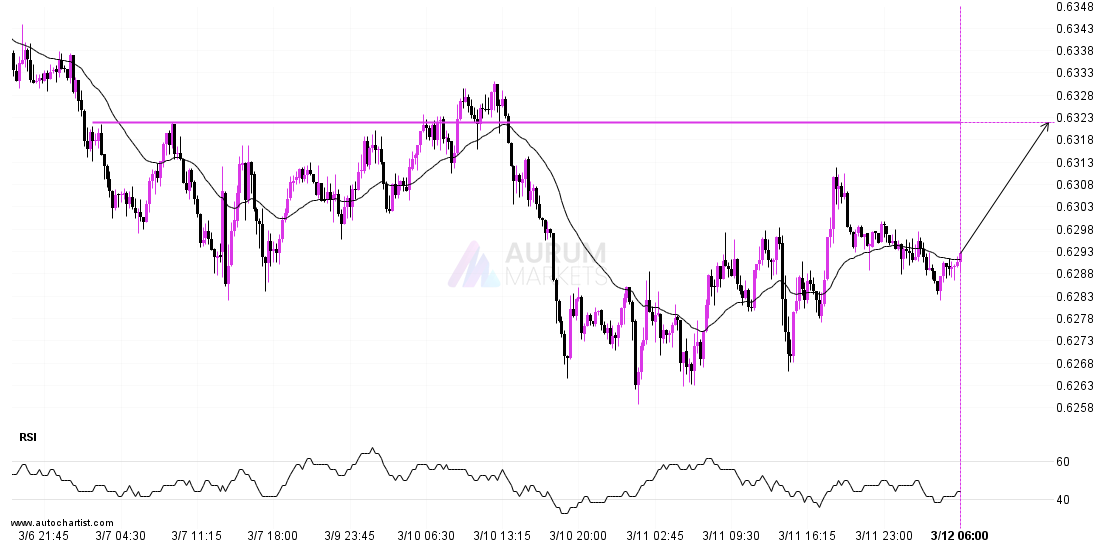
AUDUSD is moving towards a key resistance level at 0.6322. This is a previously tested level for AUDUSD. This could be a good trading opportunity, either at the spot price,
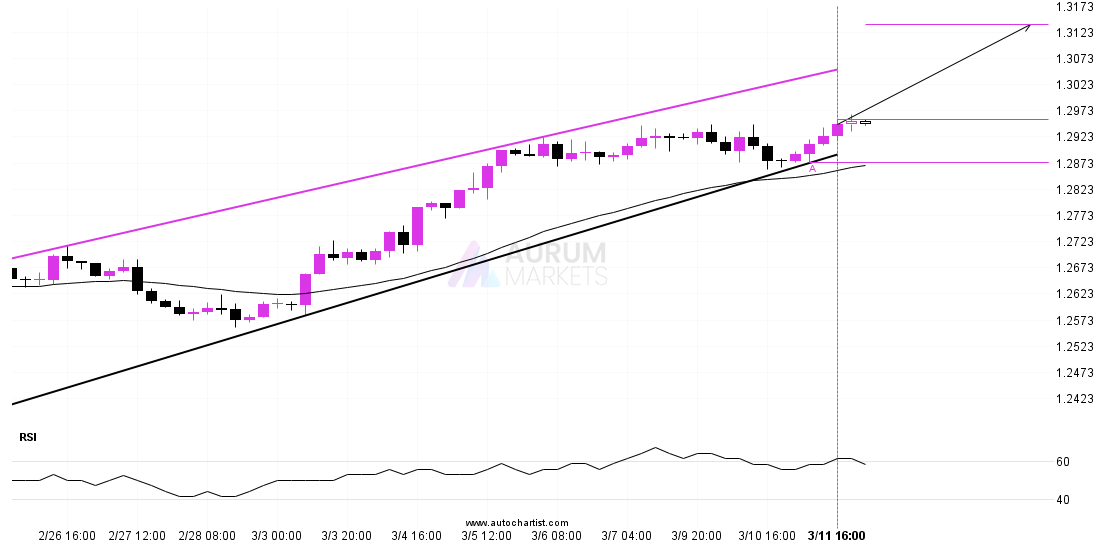
GBPUSD is trapped in a Channel Up formation, implying that a breakout is Imminent. This is a great trade-setup for both trend and swing traders. It is now approaching a
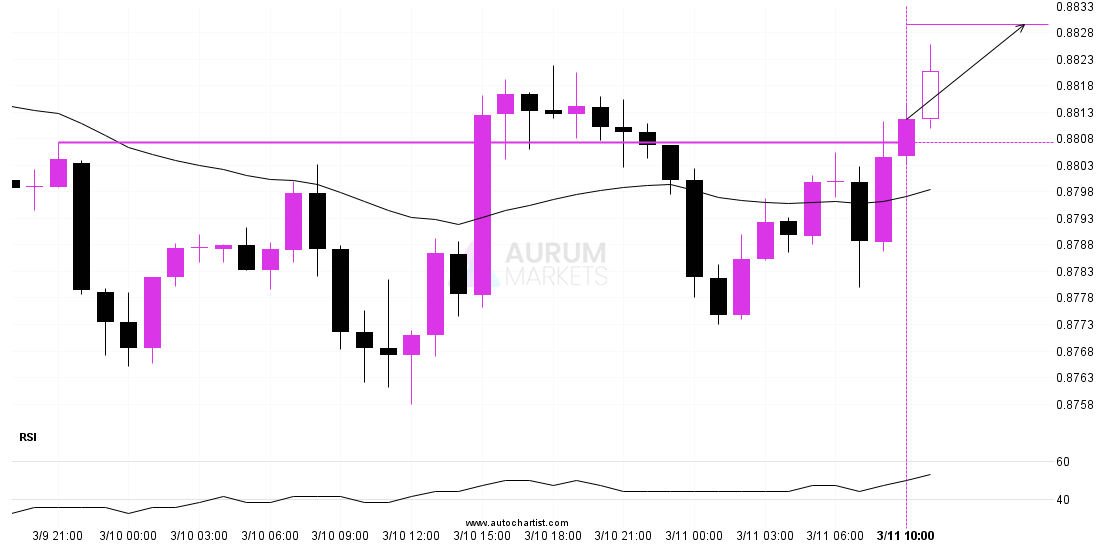
USDCHF has broken through a resistance line. It has touched this line numerous times in the last 2 days. This breakout shows a potential move to 0.8830 within the next
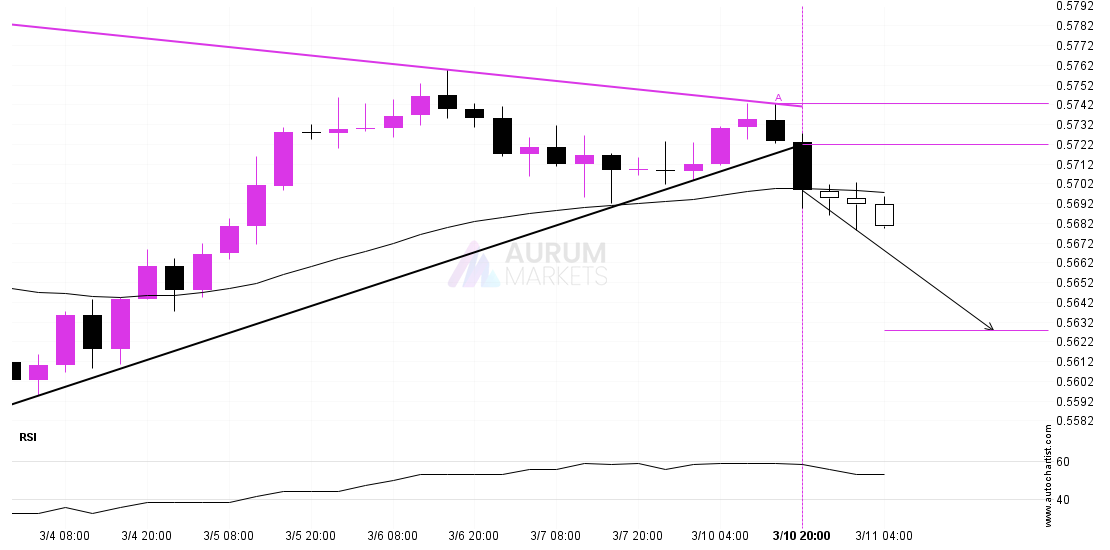
The last 15 4 hour candles on NZDUSD formed a Pennant pattern and broken out through the pattern lines, indicating a possible bearish movement towards the price level of 0.5628.
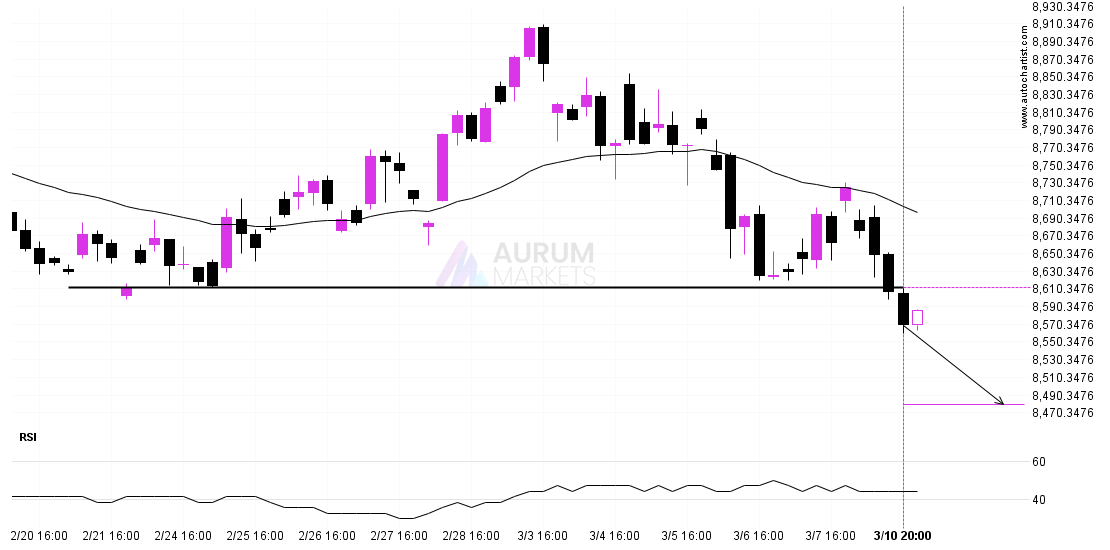
FTSE 100 has broken through 8611.7002 which it has tested numerous times in the past. We have seen it retrace from this price in the past. If this new trend
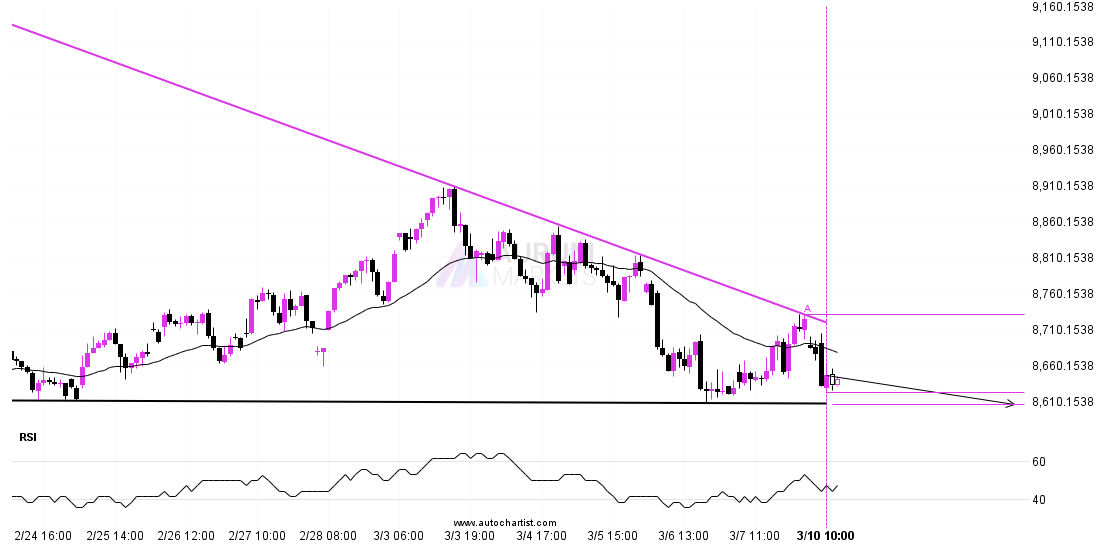
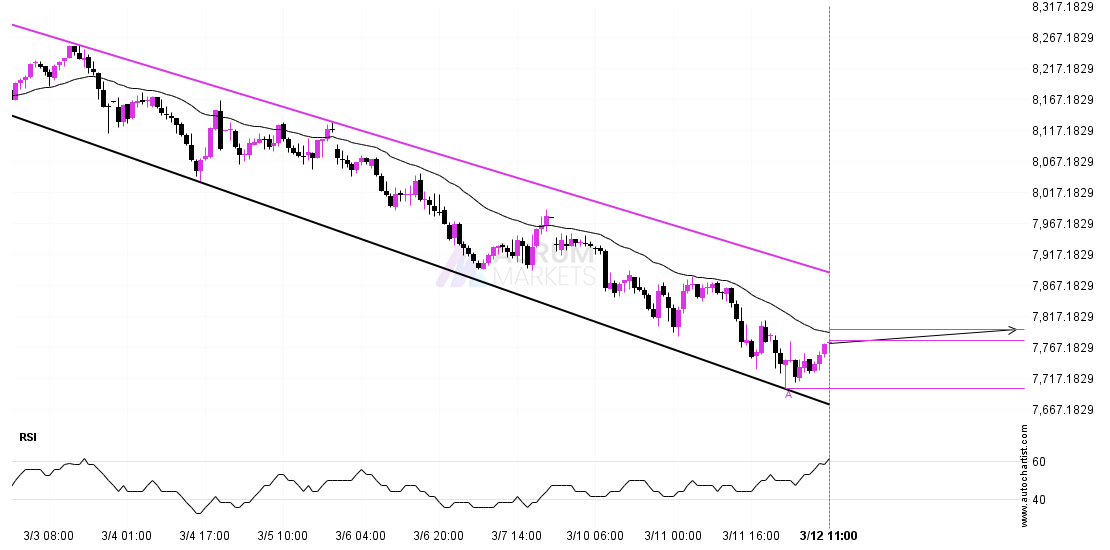
FTSE 100 is approaching the support line of a Descending Triangle. It has touched this line numerous times in the last 15 days. If it tests this line again, it