Skip to contentSkip to content
Aurum Markets Blog
  • Home
  • Technical Analysis
  • Market Insights
  • Client & IB Login
  • Register
Close Button

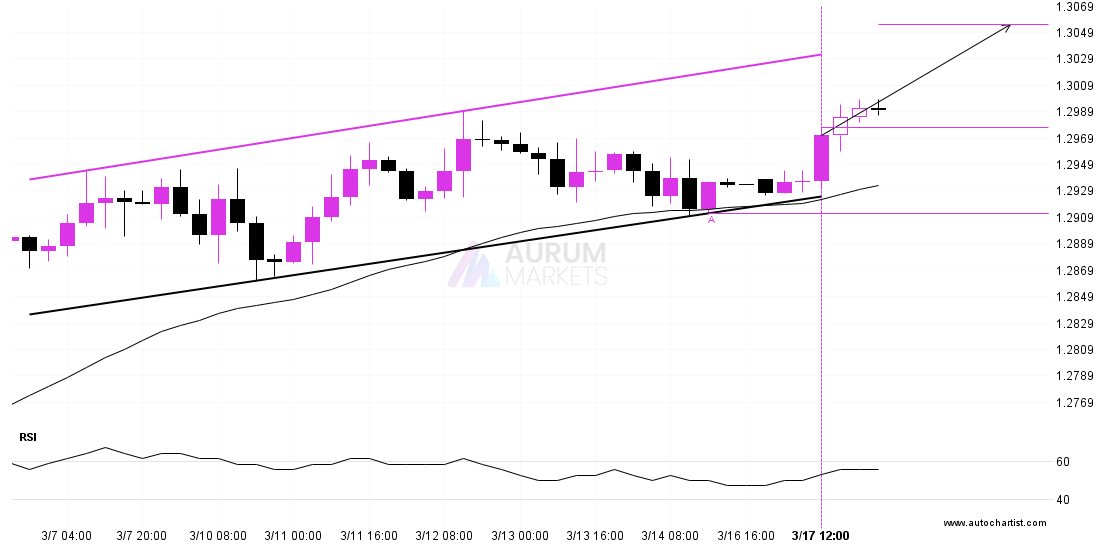
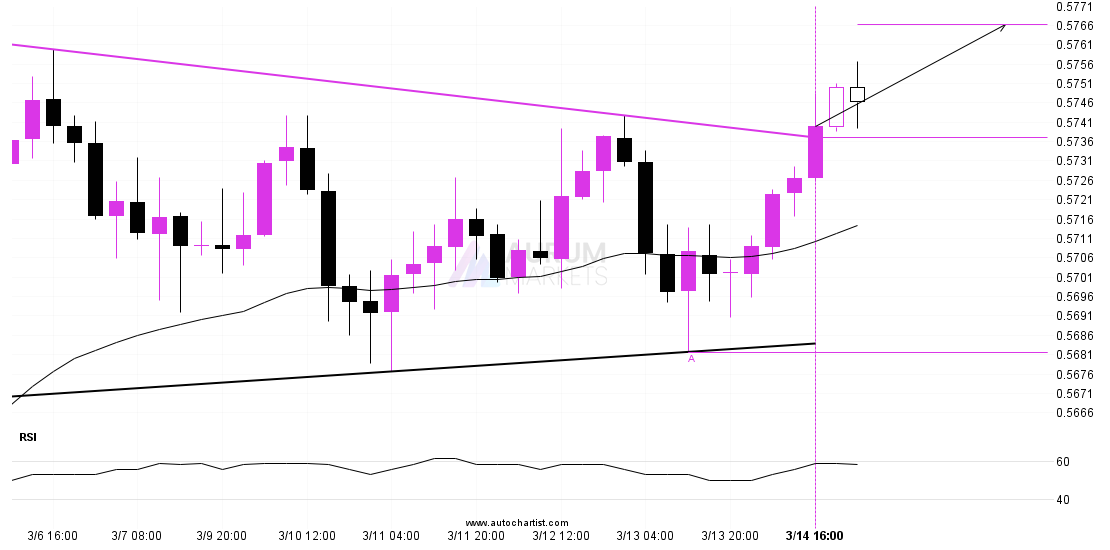
ETHUSD has broken through resistanceETHUSD has broken through resistance

March 19, 2025March 19, 2025| admin-aurumadmin-aurum| 0 Comment| 6:15 am

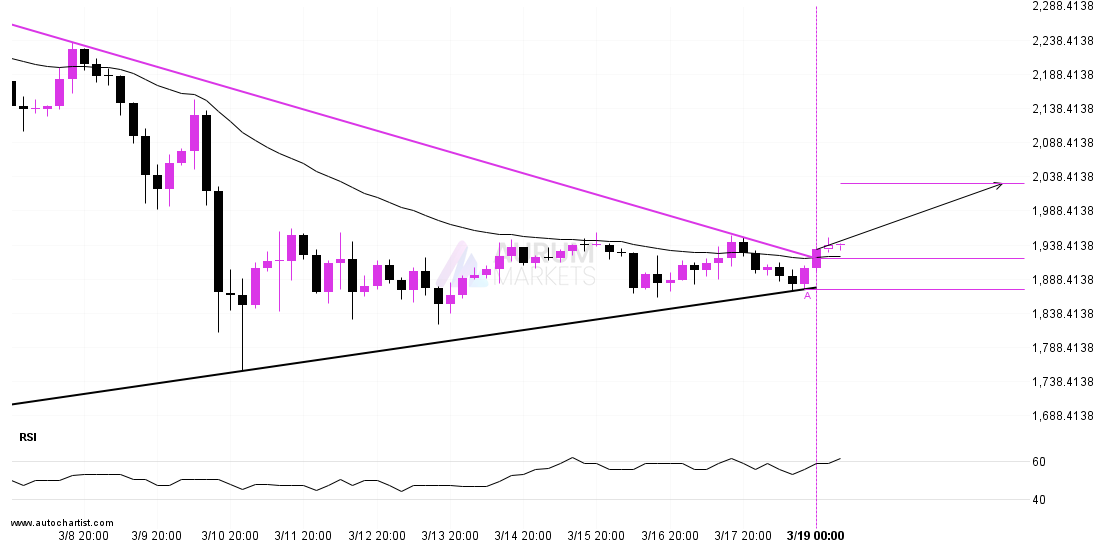
The last 16 4 hour candles on ETHUSD formed a Triangle pattern and broken out through the pattern lines, indicating a possible bullish movement towards the price level of 2029.1264.

Read MoreRead More

A final push possible on DOW 30A final push possible on DOW 30

March 18, 2025March 18, 2025| admin-aurumadmin-aurum| 0 Comment| 10:13 pm

A strong support level has been identified at 41365.8906 on the 30 Minutes DOW 30 chart. DOW 30 is likely to test it soon. Supported by Downward sloping Moving Average

Read MoreRead More

Possibility of big movement expected on BTCUSDPossibility of big movement expected on BTCUSD

March 18, 2025March 18, 2025| admin-aurumadmin-aurum| 0 Comment| 11:16 am

BTCUSD has broken through the support line which it has tested twice in the past. We have seen it retrace from this line before, so one should wait for confirmation

Read MoreRead More

LTCUSD approaching important bearish key levelLTCUSD approaching important bearish key level

March 18, 2025March 18, 2025| admin-aurumadmin-aurum| 0 Comment| 6:21 am

LTCUSD is en route to a very important line that will be a definite deciding factor of what is to come! We may see this trajectory continue to touch and

Read MoreRead More

GBPUSD – Continuation Chart Pattern – Channel UpGBPUSD – Continuation Chart Pattern – Channel Up

March 17, 2025March 17, 2025| admin-aurumadmin-aurum| 0 Comment| 10:16 pm

GBPUSD is moving towards a resistance line which it has tested numerous times in the past. We have seen it retrace from this line before, so at this stage it

Read MoreRead More

Should we expect a breakout or a rebound on FTSE 100?Should we expect a breakout or a rebound on FTSE 100?

March 17, 2025March 17, 2025| admin-aurumadmin-aurum| 0 Comment| 11:15 am

FTSE 100 is heading towards a line of 8771.7402. If this movement continues, the price of FTSE 100 could test 8771.7402 within the next 2 days. But don’t be so

Read MoreRead More

NZDUSD breakout through resistanceNZDUSD breakout through resistance

March 16, 2025March 16, 2025| admin-aurumadmin-aurum| 0 Comment| 10:15 pm

NZDUSD has broken through a resistance line. It has touched this line at least twice in the last 11 days. This breakout may indicate a potential move to 0.5766 within

Read MoreRead More

Continuation pattern on Nikkei 225Continuation pattern on Nikkei 225

March 14, 2025March 14, 2025| admin-aurumadmin-aurum| 0 Comment| 11:16 am

Nikkei 225 has broken through a resistance line. It has touched this line at least twice in the last 10 days. This breakout may indicate a potential move to 37575.9174

Read MoreRead More

DAX 40 short term bullish trade setup to 22802.1992DAX 40 short term bullish trade setup to 22802.1992

March 14, 2025March 14, 2025| admin-aurumadmin-aurum| 0 Comment| 6:15 am

DAX 40 is heading towards 22802.1992 and could reach this point within the next 3 days. It has tested this line numerous times in the past, and this time could

Read MoreRead More

Should we expect a breakout or a rebound on NZDUSD?Should we expect a breakout or a rebound on NZDUSD?

March 13, 2025March 13, 2025| admin-aurumadmin-aurum| 0 Comment| 10:14 pm

NZDUSD is heading towards the support line of a Falling Wedge. If this movement continues, the price of NZDUSD could test 0.5674 within the next 11 hours. It has tested

Read MoreRead More

Posts pagination

Previous 1 … 44 45 46 … 55 Next

Recent Posts

  • 3 Point Extension Fibonacci pattern identified at 12/27 14:30. Possible bearish price movement towards target levels ranging from 454.50 to 311.16 within the next 10 days.
  • US30 Dow Jones Industrial Average Index is approaching an important level at 48456.12
  • A potential bearish move in FRA40 CAC 40 French Index
  • Trade outlook for EURAUD from 2025-12-22 05:00:00.000 until 2025-12-22 05:00:00.000
  • Gartley Fibonacci pattern identified at 12/19 14:30. This pattern is still in the process of forming. Possible bearish price movement towards target levels ranging from 238.54 to 203.78 within the next 12 days.

Recent Comments

No comments to show.
  • Technical Analysis

Search

Archives

  • December 2025
  • November 2025
  • October 2025
  • September 2025
  • August 2025
  • July 2025
  • June 2025
  • May 2025
  • April 2025
  • March 2025
  • February 2025
  • January 2025

Meta

  • Register
  • Log in

Categories

  • Technical Analysis

Educational Landing Page WordPress Theme Copyright @ 2025 Aurum Markets Limited

Back To Top