Skip to contentSkip to content
Aurum Markets Blog
  • Home
  • Technical Analysis
  • Market Insights
  • Client & IB Login
  • Register
Close Button

Resistance breakout on DOW 30Resistance breakout on DOW 30

March 24, 2025March 24, 2025| admin-aurumadmin-aurum| 0 Comment| 11:16 am

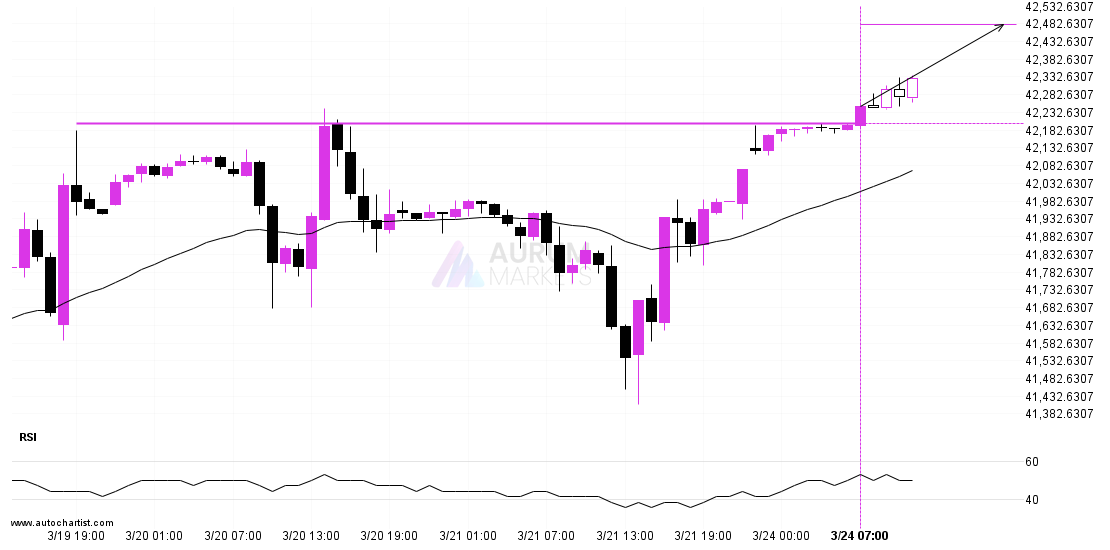
The price of DOW 30 in heading in the direction of 42479.1992. Despite the recent breakout through 42201.0898 it is possible that it will struggle to gain momentum to the

Read MoreRead More

Possible breach of resistance level by LTCUSDPossible breach of resistance level by LTCUSD

March 24, 2025March 24, 2025| admin-aurumadmin-aurum| 0 Comment| 6:20 am

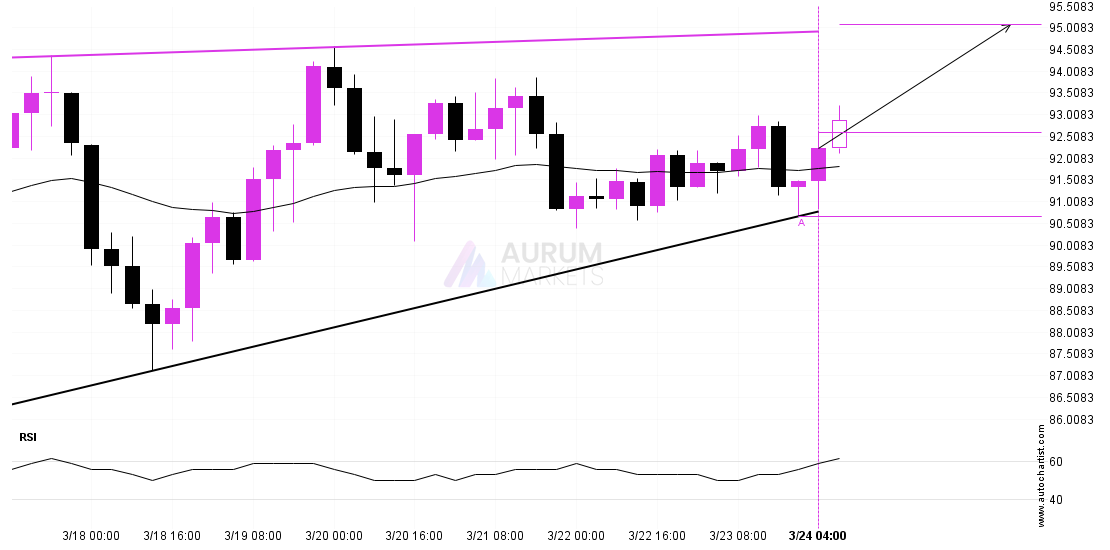
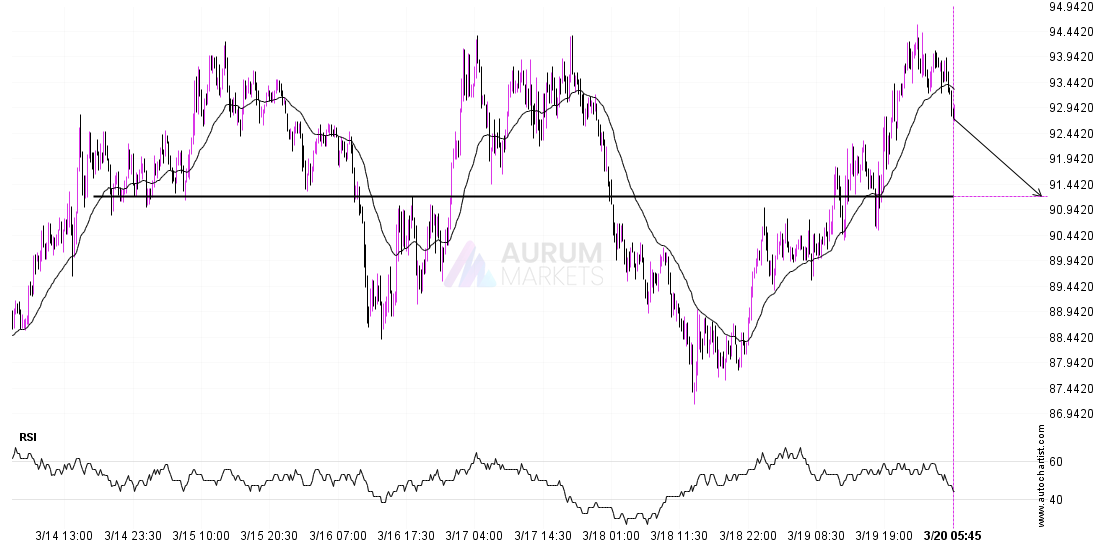
LTCUSD is heading towards the resistance line of a Ascending Triangle. If this movement continues, the price of LTCUSD could test 95.0725 within the next 2 days. It has tested

Read MoreRead More

Important price line breached by BTCUSDImportant price line breached by BTCUSD

March 23, 2025March 23, 2025| admin-aurumadmin-aurum| 0 Comment| 10:15 pm

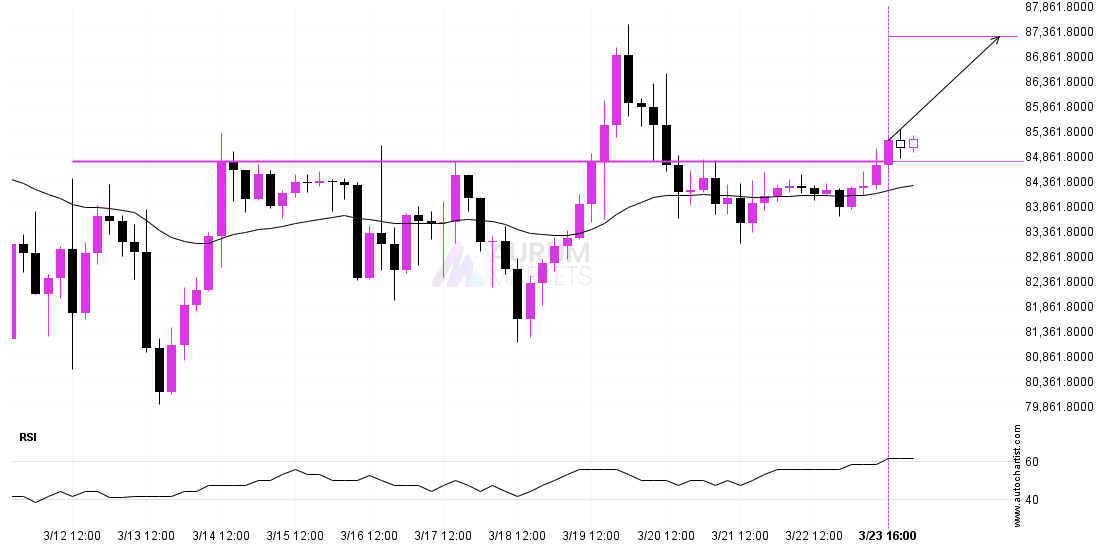
BTCUSD has broken through a line of 84760.9766 and suggests a possible movement to 87253.0938 within the next 3 days. It has tested this line numerous times in the past,

Read MoreRead More

ASX 225 approaching important level of 7841.3999ASX 225 approaching important level of 7841.3999

March 21, 2025March 21, 2025| admin-aurumadmin-aurum| 0 Comment| 11:18 am

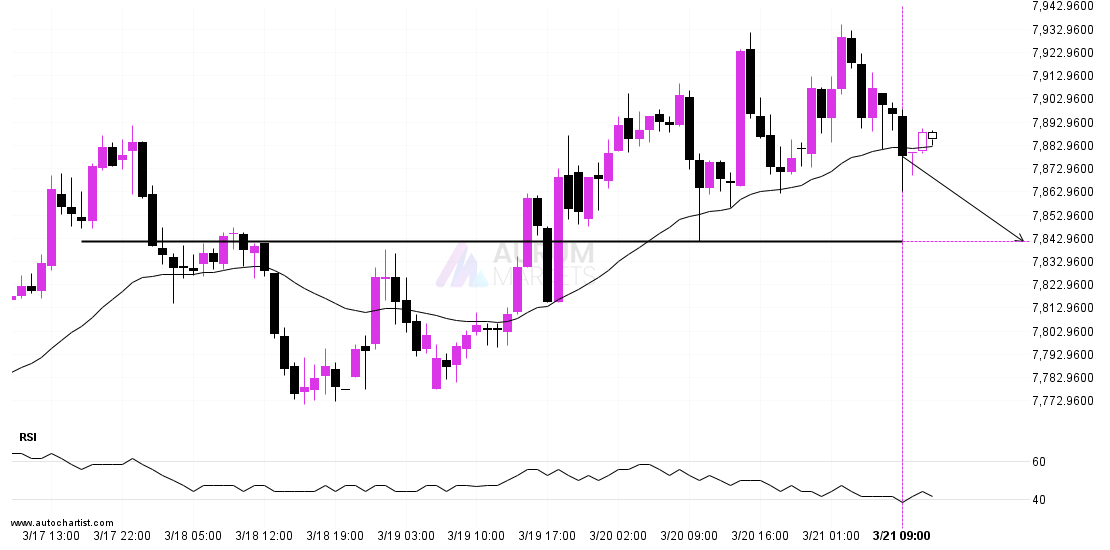
ASX 225 is moving towards a key support level at 7841.3999. ASX 225 has previously tested this level 4 times and on each occasion it has bounced back off this

Read MoreRead More

Nikkei 225 approaching support of a TriangleNikkei 225 approaching support of a Triangle

March 21, 2025March 21, 2025| admin-aurumadmin-aurum| 0 Comment| 6:17 am

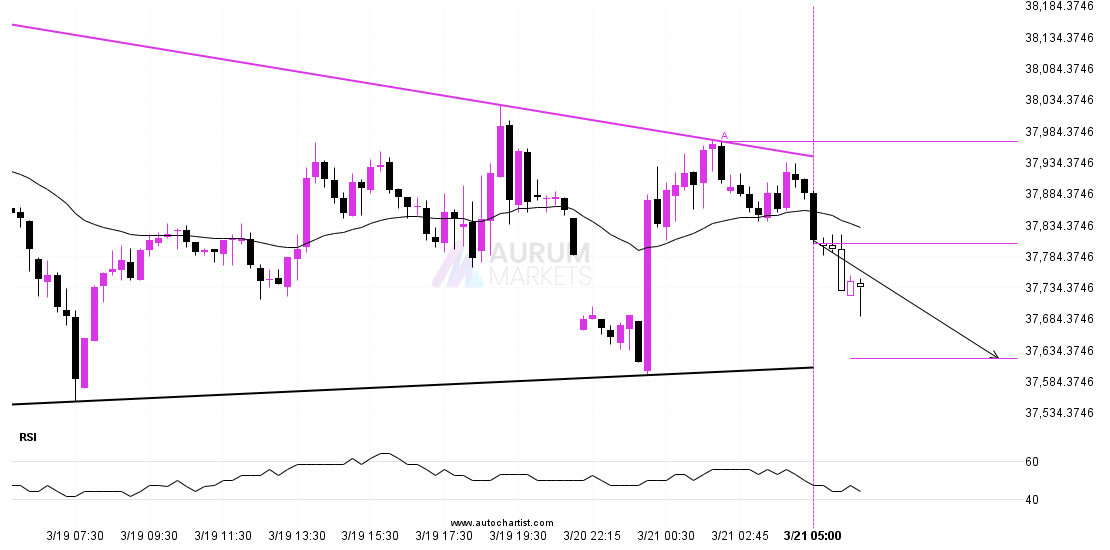
Nikkei 225 is trapped in a Triangle formation, implying that a breakout is Imminent. This is a great trade-setup for both trend and swing traders. It is now approaching a

Read MoreRead More

DOW 30 approaching support levelDOW 30 approaching support level

March 20, 2025March 20, 2025| admin-aurumadmin-aurum| 0 Comment| 10:15 pm

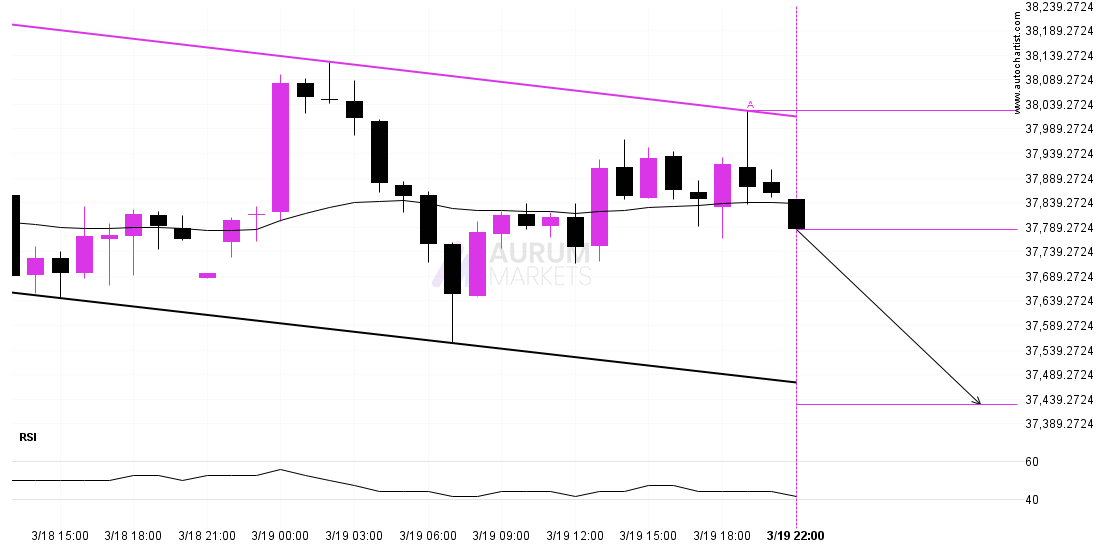
DOW 30 is en route to a very important line that will be a definite deciding factor of what is to come! We may see this trajectory continue to touch

Read MoreRead More

NZDUSD has broken through supportNZDUSD has broken through support

March 20, 2025March 20, 2025| admin-aurumadmin-aurum| 0 Comment| 11:15 am

Triangle pattern identified on NZDUSD has broken through a support level with the price momentum continuing to move in an downward direction. A solid trading opportunity continues with the price

Read MoreRead More

A potential bearish movement on LTCUSDA potential bearish movement on LTCUSD

March 20, 2025March 20, 2025| admin-aurumadmin-aurum| 0 Comment| 6:16 am

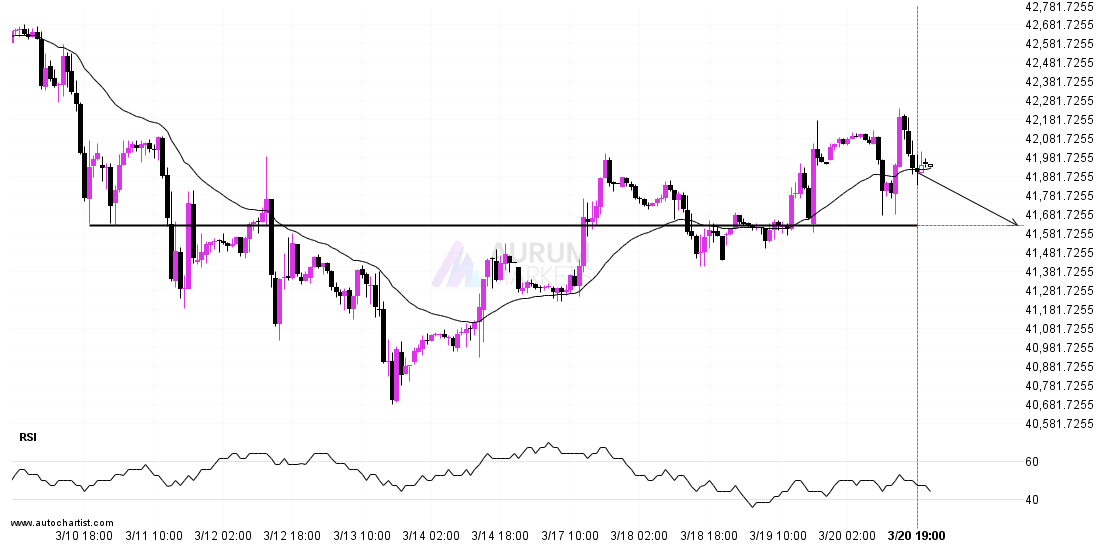
The movement of LTCUSD towards 91.2100 price line is yet another test of the line it reached numerous times in the past. We could expect this test to happen in

Read MoreRead More

Nikkei 225 – getting close to support of a Channel DownNikkei 225 – getting close to support of a Channel Down

March 19, 2025March 19, 2025| admin-aurumadmin-aurum| 0 Comment| 10:16 pm

Nikkei 225 is moving towards a support line. Because we have seen it retrace from this line before, we could see either a break through this line, or a rebound

Read MoreRead More

EURUSD short term bearish trade setup to 1.0874EURUSD short term bearish trade setup to 1.0874

March 19, 2025March 19, 2025| admin-aurumadmin-aurum| 0 Comment| 11:17 am

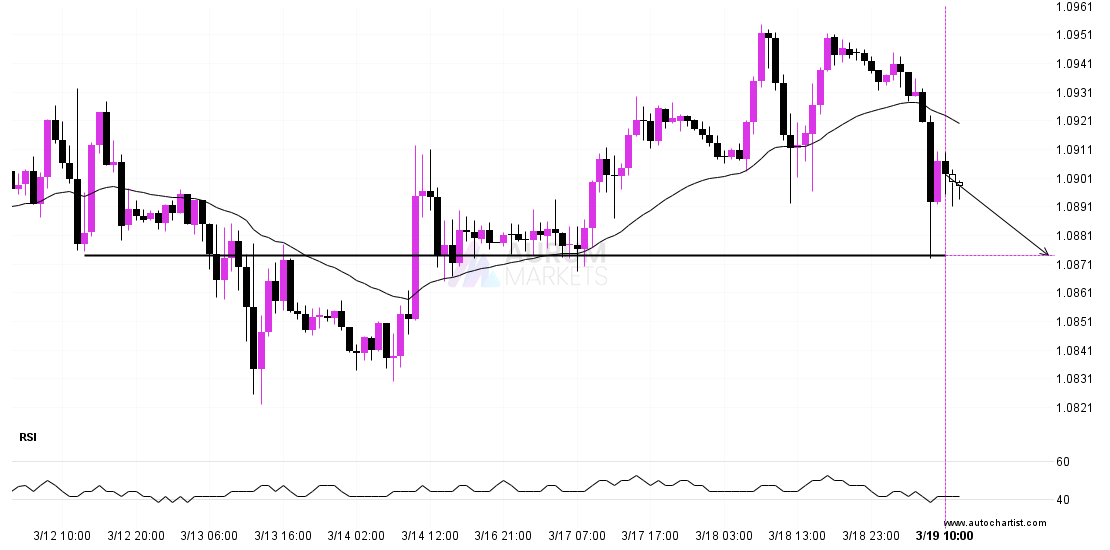
EURUSD is moving towards a line of 1.0874 which it has tested numerous times in the past. We have seen it retrace from this position in the past, so at

Read MoreRead More

Posts pagination

Previous 1 … 43 44 45 … 55 Next

Recent Posts

  • 3 Point Extension Fibonacci pattern identified at 12/27 14:30. Possible bearish price movement towards target levels ranging from 454.50 to 311.16 within the next 10 days.
  • US30 Dow Jones Industrial Average Index is approaching an important level at 48456.12
  • A potential bearish move in FRA40 CAC 40 French Index
  • Trade outlook for EURAUD from 2025-12-22 05:00:00.000 until 2025-12-22 05:00:00.000
  • Gartley Fibonacci pattern identified at 12/19 14:30. This pattern is still in the process of forming. Possible bearish price movement towards target levels ranging from 238.54 to 203.78 within the next 12 days.

Recent Comments

No comments to show.
  • Technical Analysis

Search

Archives

  • December 2025
  • November 2025
  • October 2025
  • September 2025
  • August 2025
  • July 2025
  • June 2025
  • May 2025
  • April 2025
  • March 2025
  • February 2025
  • January 2025

Meta

  • Register
  • Log in

Categories

  • Technical Analysis

Educational Landing Page WordPress Theme Copyright @ 2025 Aurum Markets Limited

Back To Top