Skip to contentSkip to content
Aurum Markets Blog
  • Home
  • Technical Analysis
  • Market Insights
  • Client & IB Login
  • Register
Close Button

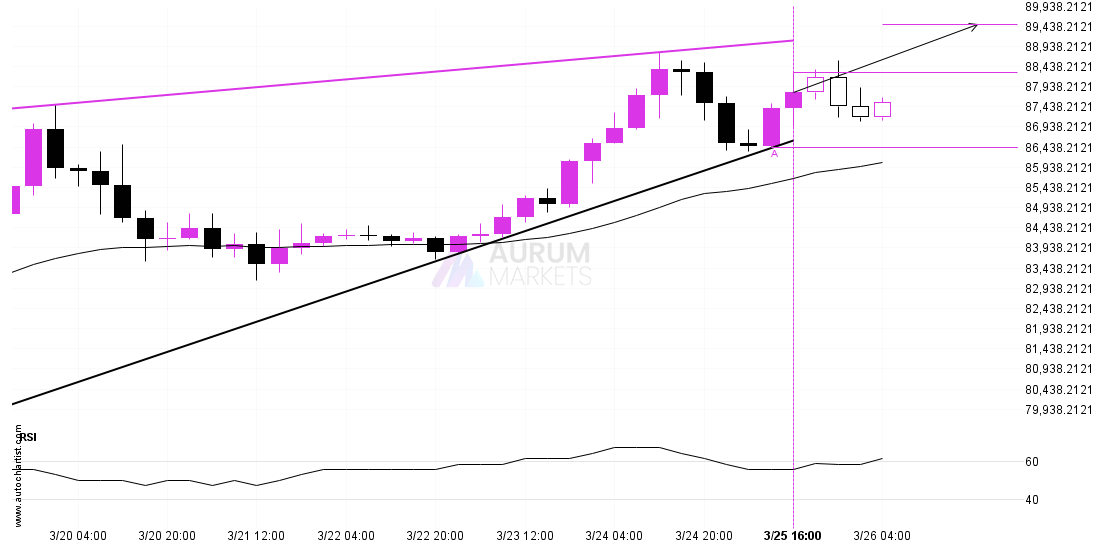
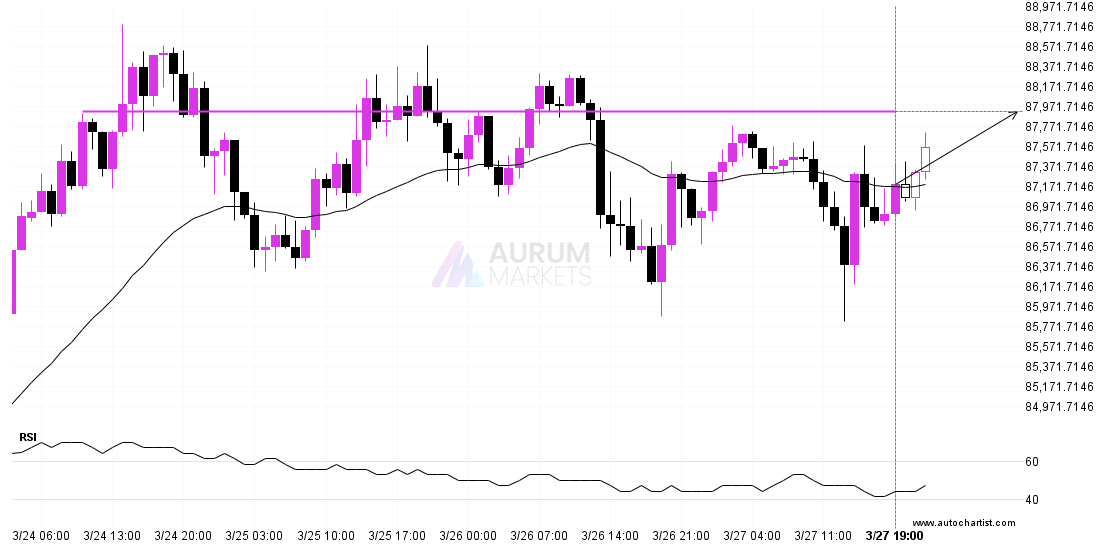
BTCUSD approaching important bullish key levelBTCUSD approaching important bullish key level

March 27, 2025March 27, 2025| admin-aurumadmin-aurum| 0 Comment| 10:16 pm

BTCUSD is moving towards a key resistance level at 87922.6094. BTCUSD has previously tested this level 3 times and on each occasion it has bounced back off this level. Is

Read MoreRead More

A potential bearish movement on AUDUSDA potential bearish movement on AUDUSD

March 27, 2025March 27, 2025| admin-aurumadmin-aurum| 0 Comment| 11:14 am

AUDUSD is moving towards a support line which it has tested numerous times in the past. We have seen it retrace from this line before, so at this stage it

Read MoreRead More

DOW 30 is on the approachDOW 30 is on the approach

March 27, 2025March 27, 2025| admin-aurumadmin-aurum| 0 Comment| 6:13 am

DOW 30 is heading towards a line of 42684.3281. If this movement continues, the price of DOW 30 could test 42684.3281 within the next 11 hours. But don’t be so

Read MoreRead More

Should we expect a bearish trend on ASX 225?Should we expect a bearish trend on ASX 225?

March 26, 2025March 26, 2025| admin-aurumadmin-aurum| 0 Comment| 10:14 pm

ASX 225 has broken through a support line of a Rising Wedge and suggests a possible movement to 7907.8306 within the next 17 hours. It has tested this line in

Read MoreRead More

Possible start of a bullish trend as LTCUSD breaks resistancePossible start of a bullish trend as LTCUSD breaks resistance

March 26, 2025March 26, 2025| admin-aurumadmin-aurum| 0 Comment| 11:16 am

LTCUSD has broken through a resistance line. Because we have seen it retrace from this price in the past, one should wait for confirmation of the breakout before trading. It

Read MoreRead More

BTCUSD – Continuation Chart Pattern – Rising WedgeBTCUSD – Continuation Chart Pattern – Rising Wedge

March 26, 2025March 26, 2025| admin-aurumadmin-aurum| 0 Comment| 6:19 am

An emerging Rising Wedge has been detected on BTCUSD on the 4 hour chart. There is a possible move towards 89468.1667 next few candles. Once reaching support it may continue

Read MoreRead More

Should we expect a breakout or a rebound on ASX 225?Should we expect a breakout or a rebound on ASX 225?

March 25, 2025March 25, 2025| admin-aurumadmin-aurum| 0 Comment| 10:16 pm

An emerging Rectangle has been detected on ASX 225 on the 15 Minutes chart. There is a possible move towards 7909.9267 next few candles. Once reaching resistance it may continue

Read MoreRead More

Possibility of big movement expected on NZDUSDPossibility of big movement expected on NZDUSD

March 25, 2025March 25, 2025| admin-aurumadmin-aurum| 0 Comment| 11:14 am

This trade setup on NZDUSD is formed by a period of consolidation; a period in which the price primarily moves sideways before choosing a new direction for the longer term.

Read MoreRead More

Nikkei 225 – psychological price line breachedNikkei 225 – psychological price line breached

March 25, 2025March 25, 2025| admin-aurumadmin-aurum| 0 Comment| 6:16 am

The price of Nikkei 225 in heading in the direction of 38226.1992. Despite the recent breakout through 37994.0000 it is possible that it will struggle to gain momentum to the

Read MoreRead More

Should we expect a breakout or a rebound on USDCHF?Should we expect a breakout or a rebound on USDCHF?

March 24, 2025March 24, 2025| admin-aurumadmin-aurum| 0 Comment| 10:16 pm

A Rectangle pattern was identified on USDCHF at 0.882355, creating an expectation that it may move to the support line at 0.8754. It may break through that line and continue

Read MoreRead More

Posts pagination

Previous 1 … 42 43 44 … 55 Next

Recent Posts

  • 3 Point Extension Fibonacci pattern identified at 12/27 14:30. Possible bearish price movement towards target levels ranging from 454.50 to 311.16 within the next 10 days.
  • US30 Dow Jones Industrial Average Index is approaching an important level at 48456.12
  • A potential bearish move in FRA40 CAC 40 French Index
  • Trade outlook for EURAUD from 2025-12-22 05:00:00.000 until 2025-12-22 05:00:00.000
  • Gartley Fibonacci pattern identified at 12/19 14:30. This pattern is still in the process of forming. Possible bearish price movement towards target levels ranging from 238.54 to 203.78 within the next 12 days.

Recent Comments

No comments to show.
  • Technical Analysis

Search

Archives

  • December 2025
  • November 2025
  • October 2025
  • September 2025
  • August 2025
  • July 2025
  • June 2025
  • May 2025
  • April 2025
  • March 2025
  • February 2025
  • January 2025

Meta

  • Register
  • Log in

Categories

  • Technical Analysis

Educational Landing Page WordPress Theme Copyright @ 2025 Aurum Markets Limited

Back To Top