Skip to contentSkip to content
Aurum Markets Blog
  • Home
  • Technical Analysis
  • Market Insights
  • Client & IB Login
  • Register
Close Button

A potential bullish movement on EURUSDA potential bullish movement on EURUSD

April 8, 2025April 8, 2025| admin-aurumadmin-aurum| 0 Comment| 6:14 am

An emerging Triangle has been detected on EURUSD on the 1 hour chart. There is a possible move towards 1.0997 next few candles. Once reaching support it may continue its

Read MoreRead More

A final push possible on AUDUSDA final push possible on AUDUSD

April 7, 2025April 7, 2025| admin-aurumadmin-aurum| 0 Comment| 10:15 pm

AUDUSD is heading towards a line of 0.6010. If this movement continues, the price of AUDUSD could test 0.6010 within the next 5 hours. But don’t be so quick to

Read MoreRead More

Should we expect a breakout or a rebound on USDCHF?Should we expect a breakout or a rebound on USDCHF?

April 7, 2025April 7, 2025| admin-aurumadmin-aurum| 0 Comment| 11:17 am

USDCHF was identified at around 0.8451 having recently rebounded of the resistance on the 4 hour data interval. Ultimately, the price action of the stock has formed a Channel Down

Read MoreRead More

A potential bullish movement on ASX 225A potential bullish movement on ASX 225

April 2, 2025April 2, 2025| admin-aurumadmin-aurum| 0 Comment| 10:14 pm

A strong resistance level has been identified at 7951.2002 on the 1 hour ASX 225 chart. ASX 225 is likely to test it soon. Supported by Upward sloping Moving Average

Read MoreRead More

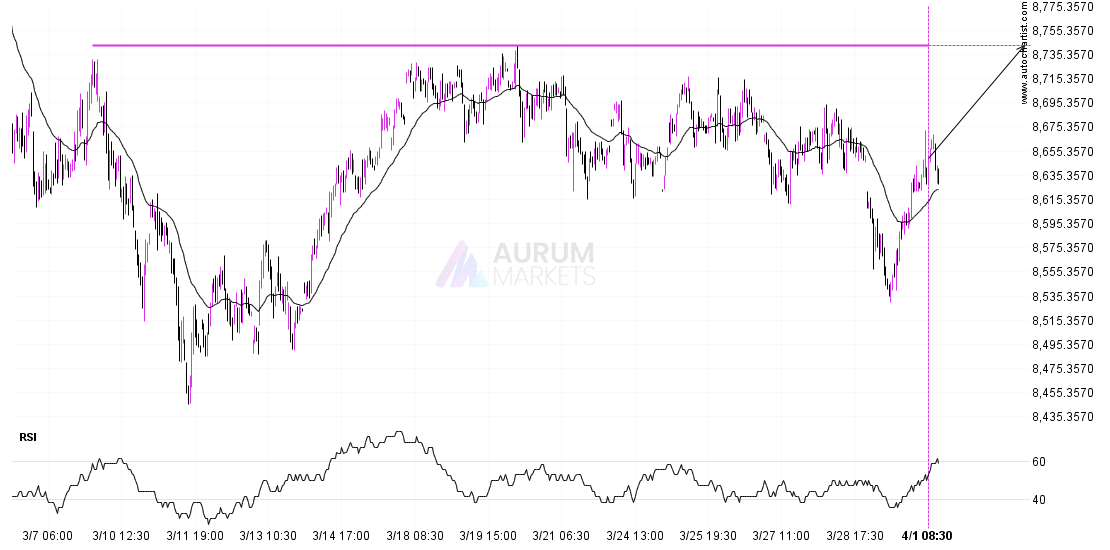
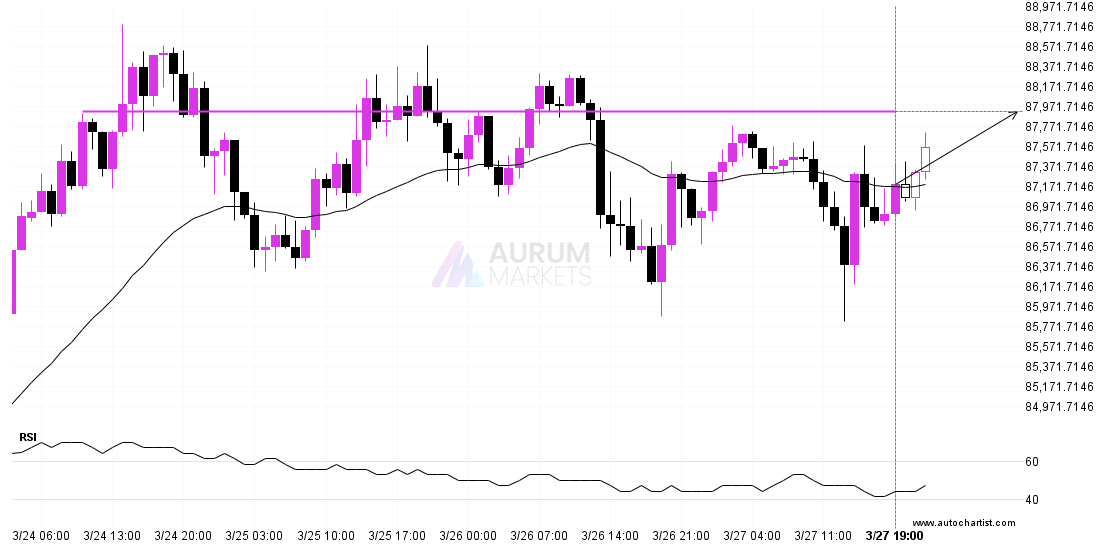
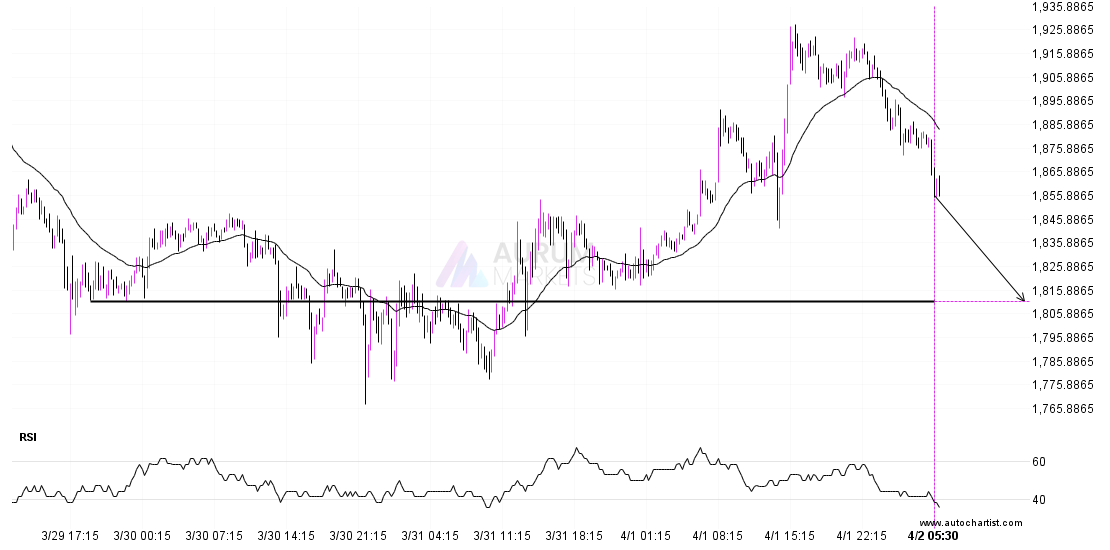
Should we expect a breakout or a rebound on ETHUSD?Should we expect a breakout or a rebound on ETHUSD?

April 2, 2025April 2, 2025| admin-aurumadmin-aurum| 0 Comment| 6:15 am

ETHUSD is moving towards a line of 1811.0699 which it has tested numerous times in the past. We have seen it retrace from this position in the past, so at

Read MoreRead More

A potential bullish movement on USDCHFA potential bullish movement on USDCHF

April 1, 2025April 1, 2025| admin-aurumadmin-aurum| 0 Comment| 10:15 pm

USDCHF is heading towards the resistance line of a Ascending Triangle and could reach this point within the next 2 days. It has tested this line numerous times in the

Read MoreRead More

FTSE 100 is on the approachFTSE 100 is on the approach

April 1, 2025April 1, 2025| admin-aurumadmin-aurum| 0 Comment| 11:16 am

FTSE 100 is moving towards a line of 8742.5000 which it has tested numerous times in the past. We have seen it retrace from this position in the past, so

Read MoreRead More

Breach of important price line imminent by LTCUSDBreach of important price line imminent by LTCUSD

March 31, 2025March 31, 2025| admin-aurumadmin-aurum| 0 Comment| 6:14 am

A strong support level has been identified at 84.5100 on the 15 Minutes LTCUSD chart. LTCUSD is likely to test it soon. Supported by Downward sloping Moving Average Target: 84.51

Read MoreRead More

ASX 225 – support line breachedASX 225 – support line breached

March 30, 2025March 30, 2025| admin-aurumadmin-aurum| 0 Comment| 10:15 pm

This trade setup on ASX 225 is formed by a period of consolidation; a period in which the price primarily moves sideways before choosing a new direction for the longer

Read MoreRead More

FTSE 100 approaching resistance levelFTSE 100 approaching resistance level

March 28, 2025March 28, 2025| admin-aurumadmin-aurum| 0 Comment| 11:15 am

FTSE 100 is heading towards 8693.8496 and could reach this point within the next 7 hours. It has tested this line numerous times in the past, and this time could

Read MoreRead More

Posts pagination

Previous 1 … 41 42 43 … 55 Next

Recent Posts

  • 3 Point Extension Fibonacci pattern identified at 12/27 14:30. Possible bearish price movement towards target levels ranging from 454.50 to 311.16 within the next 10 days.
  • US30 Dow Jones Industrial Average Index is approaching an important level at 48456.12
  • A potential bearish move in FRA40 CAC 40 French Index
  • Trade outlook for EURAUD from 2025-12-22 05:00:00.000 until 2025-12-22 05:00:00.000
  • Gartley Fibonacci pattern identified at 12/19 14:30. This pattern is still in the process of forming. Possible bearish price movement towards target levels ranging from 238.54 to 203.78 within the next 12 days.

Recent Comments

No comments to show.
  • Technical Analysis

Search

Archives

  • December 2025
  • November 2025
  • October 2025
  • September 2025
  • August 2025
  • July 2025
  • June 2025
  • May 2025
  • April 2025
  • March 2025
  • February 2025
  • January 2025

Meta

  • Register
  • Log in

Categories

  • Technical Analysis

Educational Landing Page WordPress Theme Copyright @ 2025 Aurum Markets Limited

Back To Top