Skip to contentSkip to content
Aurum Markets Blog
  • Home
  • Technical Analysis
  • Market Insights
  • Client & IB Login
  • Register
Close Button

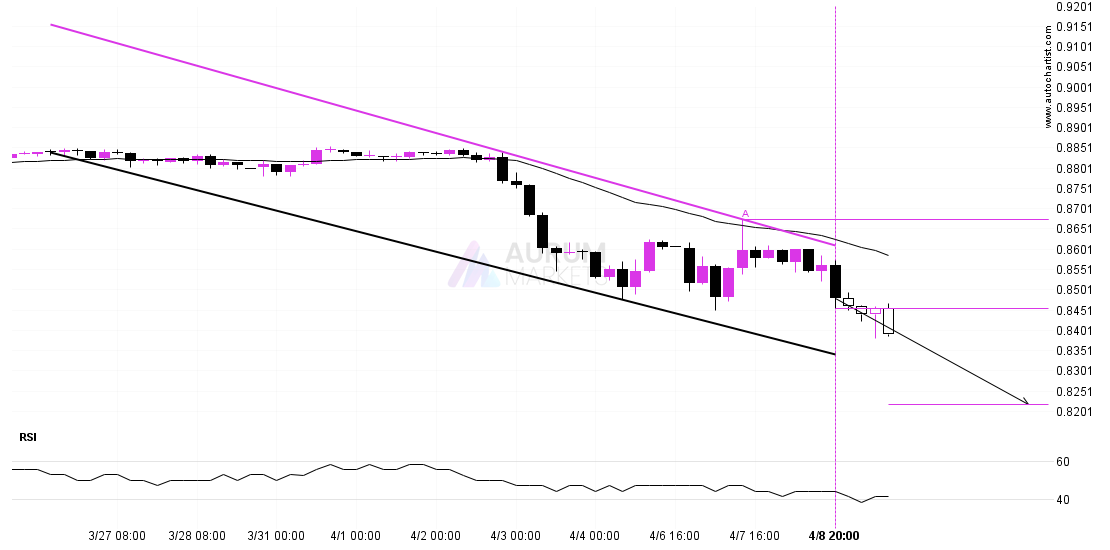
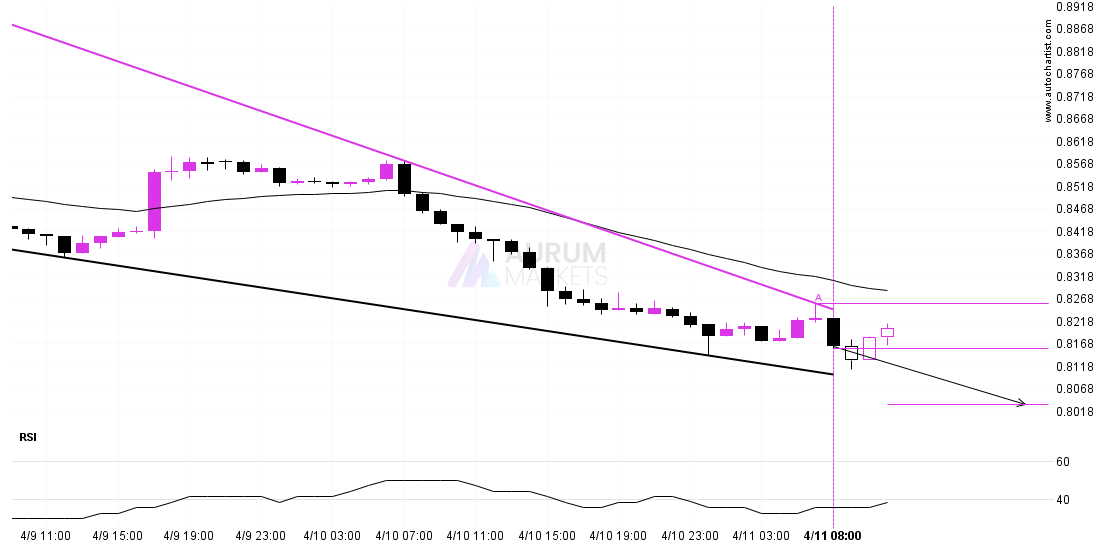
USDCHF – getting close to support of a Falling WedgeUSDCHF – getting close to support of a Falling Wedge

April 11, 2025April 11, 2025| admin-aurumadmin-aurum| 0 Comment| 11:14 am

USDCHF is approaching the support line of a Falling Wedge. It has touched this line numerous times in the last 3 days. If it tests this line again, it should

Read MoreRead More

LTCUSD is on the approachLTCUSD is on the approach

April 11, 2025April 11, 2025| admin-aurumadmin-aurum| 0 Comment| 6:15 am

The price of LTCUSD in heading back to the resistance area. It is possible that it will struggle to break through it and move back in the other direction. The

Read MoreRead More

DOW 30 approaching resistance of a Rising WedgeDOW 30 approaching resistance of a Rising Wedge

April 10, 2025April 10, 2025| admin-aurumadmin-aurum| 0 Comment| 10:14 pm

Emerging Rising Wedge detected on DOW 30 – the pattern is an emerging one and has not yet broken through support, but the price is expected to move up over

Read MoreRead More

Should we expect a breakout or a rebound on EURUSD?Should we expect a breakout or a rebound on EURUSD?

April 10, 2025April 10, 2025| admin-aurumadmin-aurum| 0 Comment| 11:18 am

EURUSD is approaching a resistance line at 1.1099. If it hits the resistance line, it may break through this level to continue the bullish trend, or it may turn around

Read MoreRead More

LTCUSD – Continuation Chart Pattern – Channel UpLTCUSD – Continuation Chart Pattern – Channel Up

April 10, 2025April 10, 2025| admin-aurumadmin-aurum| 0 Comment| 6:13 am

An emerging Channel Up has been detected on LTCUSD on the 1 hour chart. There is a possible move towards 69.7610 next few candles. Once reaching resistance it may continue

Read MoreRead More

DAX 40 approaching resistance levelDAX 40 approaching resistance level

April 9, 2025April 9, 2025| admin-aurumadmin-aurum| 0 Comment| 10:16 pm

DAX 40 is heading towards 22702.6992 and could reach this point within the next 2 days. It has tested this line numerous times in the past, and this time could

Read MoreRead More

Possible breach of support level by USDCHFPossible breach of support level by USDCHF

April 9, 2025April 9, 2025| admin-aurumadmin-aurum| 0 Comment| 11:16 am

USDCHF is trapped in a Channel Down formation, implying that a breakout is Imminent. This is a great trade-setup for both trend and swing traders. It is now approaching a

Read MoreRead More

Possible start of a bearish trend as USDJPY breaks supportPossible start of a bearish trend as USDJPY breaks support

April 9, 2025April 9, 2025| admin-aurumadmin-aurum| 0 Comment| 6:15 am

USDJPY has breached the support line at 145.0465. It may continue the bearish trend towards 143.8040, or, it may prove to be yet another test of this level. Supported by

Read MoreRead More

ETHUSD approaching support of a Channel DownETHUSD approaching support of a Channel Down

April 8, 2025April 8, 2025| admin-aurumadmin-aurum| 0 Comment| 10:17 pm

Emerging Channel Down detected on ETHUSD – the pattern is an emerging one and has not yet broken through resistance, but the price is expected to move up over the

Read MoreRead More

A final push possible on LTCUSDA final push possible on LTCUSD

April 8, 2025April 8, 2025| admin-aurumadmin-aurum| 0 Comment| 11:15 am

A strong resistance level has been identified at 73.1200 on the 15 Minutes LTCUSD chart. LTCUSD is likely to test it soon. Supported by Upward sloping Moving Average Target: 73.12

Read MoreRead More

Posts pagination

Previous 1 … 40 41 42 … 55 Next

Recent Posts

  • 3 Point Extension Fibonacci pattern identified at 12/27 14:30. Possible bearish price movement towards target levels ranging from 454.50 to 311.16 within the next 10 days.
  • US30 Dow Jones Industrial Average Index is approaching an important level at 48456.12
  • A potential bearish move in FRA40 CAC 40 French Index
  • Trade outlook for EURAUD from 2025-12-22 05:00:00.000 until 2025-12-22 05:00:00.000
  • Gartley Fibonacci pattern identified at 12/19 14:30. This pattern is still in the process of forming. Possible bearish price movement towards target levels ranging from 238.54 to 203.78 within the next 12 days.

Recent Comments

No comments to show.
  • Technical Analysis

Search

Archives

  • December 2025
  • November 2025
  • October 2025
  • September 2025
  • August 2025
  • July 2025
  • June 2025
  • May 2025
  • April 2025
  • March 2025
  • February 2025
  • January 2025

Meta

  • Register
  • Log in

Categories

  • Technical Analysis

Educational Landing Page WordPress Theme Copyright @ 2025 Aurum Markets Limited

Back To Top