Skip to contentSkip to content
Aurum Markets Blog
  • Home
  • Technical Analysis
  • Market Insights
  • Client & IB Login
  • Register
Close Button

AUDUSD has broken through supportAUDUSD has broken through support

April 16, 2025April 16, 2025| admin-aurumadmin-aurum| 0 Comment| 10:17 pm

AUDUSD has broken through a support line of a Rising Wedge chart pattern. If this breakout holds true, we may see the price of AUDUSD testing 0.6247 within the next

Read MoreRead More

ASX 225 short term bullish trade setup to 7789.7002ASX 225 short term bullish trade setup to 7789.7002

April 16, 2025April 16, 2025| admin-aurumadmin-aurum| 0 Comment| 11:15 am

ASX 225 is moving towards a resistance line. Because we have seen it retrace from this level in the past, we could see either a break through this line, or

Read MoreRead More

Resistance line breached by ASX 225Resistance line breached by ASX 225

April 16, 2025April 16, 2025| admin-aurumadmin-aurum| 0 Comment| 6:17 am

ASX 225 has broken through the resistance line of a Triangle technical chart pattern. Because we have seen it retrace from this line in the past, one should wait for

Read MoreRead More

USDCHF – resistance line broken at 2025-04-15T17:00:00.000ZUSDCHF – resistance line broken at 2025-04-15T17:00:00.000Z

April 15, 2025April 15, 2025| admin-aurumadmin-aurum| 0 Comment| 10:15 pm

USDCHF is once again retesting a key horizontal resistance level at 0.8194. It has tested this level 3 times in the recent past and could simply bounce off like it

Read MoreRead More

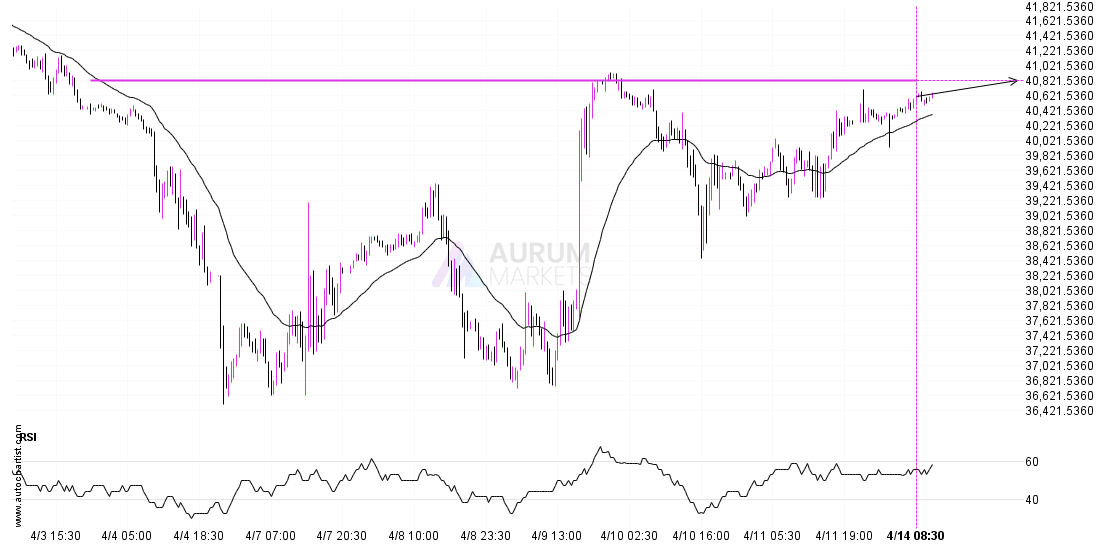
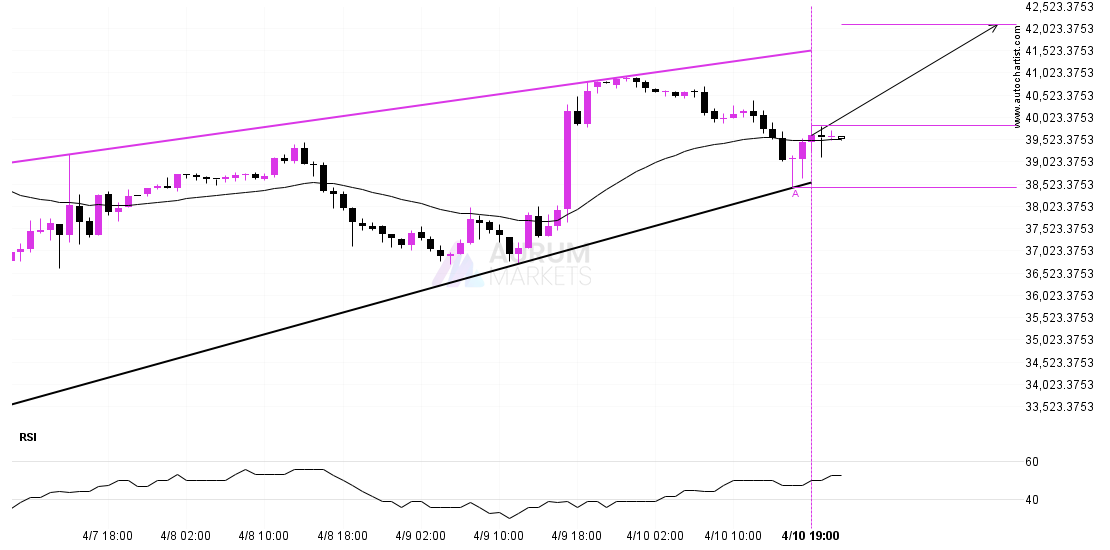
Possible breach of resistance level by LTCUSDPossible breach of resistance level by LTCUSD

April 15, 2025April 15, 2025| admin-aurumadmin-aurum| 0 Comment| 11:16 am

LTCUSD is trapped in a Rising Wedge formation, implying that a breakout is Imminent. This is a great trade-setup for both trend and swing traders. It is now approaching a

Read MoreRead More

EURUSD approaches important level of 1.1385EURUSD approaches important level of 1.1385

April 15, 2025April 15, 2025| admin-aurumadmin-aurum| 0 Comment| 6:14 am

EURUSD is moving towards a key resistance level at 1.1385. EURUSD has previously tested this level 3 times and on each occasion it has bounced back off this level. Is

Read MoreRead More

Should we expect a breakout or a rebound on USDCAD?Should we expect a breakout or a rebound on USDCAD?

April 14, 2025April 14, 2025| admin-aurumadmin-aurum| 0 Comment| 10:16 pm

An emerging Channel Down has been detected on USDCAD on the 1 hour chart. There is a possible move towards 1.3819 next few candles. Once reaching resistance it may continue

Read MoreRead More

A potential bullish movement on DOW 30A potential bullish movement on DOW 30

April 14, 2025April 14, 2025| admin-aurumadmin-aurum| 0 Comment| 11:16 am

The price of DOW 30 in heading back to the resistance area. It is possible that it will struggle to break through it and move back in the other direction.

Read MoreRead More

Possibility of big movement expected on AUDUSDPossibility of big movement expected on AUDUSD

April 14, 2025April 14, 2025| admin-aurumadmin-aurum| 0 Comment| 6:14 am

AUDUSD has broken through a support line of a Rising Wedge and suggests a possible movement to 0.6221 within the next 22 hours. It has tested this line in the

Read MoreRead More

A potential bullish movement on Nikkei 225A potential bullish movement on Nikkei 225

April 13, 2025April 13, 2025| admin-aurumadmin-aurum| 0 Comment| 10:15 pm

Nikkei 225 is heading towards a line of 33884.0000. If this movement continues, the price of Nikkei 225 could test 33884.0000 within the next 19 hours. But don’t be so

Read MoreRead More

Posts pagination

Previous 1 … 39 40 41 … 55 Next

Recent Posts

  • 3 Point Extension Fibonacci pattern identified at 12/27 14:30. Possible bearish price movement towards target levels ranging from 454.50 to 311.16 within the next 10 days.
  • US30 Dow Jones Industrial Average Index is approaching an important level at 48456.12
  • A potential bearish move in FRA40 CAC 40 French Index
  • Trade outlook for EURAUD from 2025-12-22 05:00:00.000 until 2025-12-22 05:00:00.000
  • Gartley Fibonacci pattern identified at 12/19 14:30. This pattern is still in the process of forming. Possible bearish price movement towards target levels ranging from 238.54 to 203.78 within the next 12 days.

Recent Comments

No comments to show.
  • Technical Analysis

Search

Archives

  • December 2025
  • November 2025
  • October 2025
  • September 2025
  • August 2025
  • July 2025
  • June 2025
  • May 2025
  • April 2025
  • March 2025
  • February 2025
  • January 2025

Meta

  • Register
  • Log in

Categories

  • Technical Analysis

Educational Landing Page WordPress Theme Copyright @ 2025 Aurum Markets Limited

Back To Top