EURUSD breakout through resistanceEURUSD breakout through resistance
EURUSD is once again retesting a key horizontal resistance level at 1.1535. It has tested this level 4 times in the recent past and could simply bounce off like it

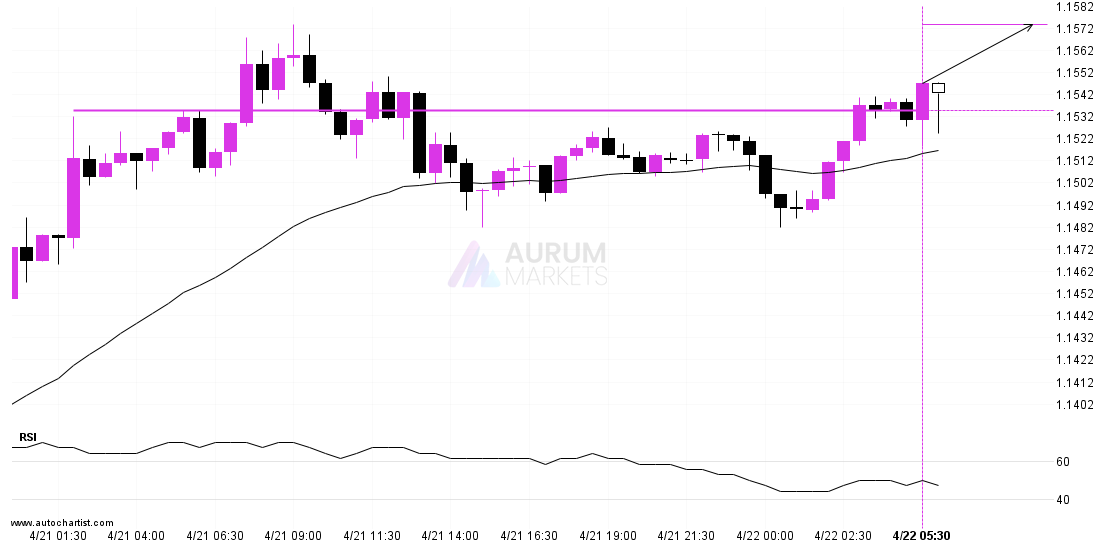
EURUSD is once again retesting a key horizontal resistance level at 1.1535. It has tested this level 4 times in the recent past and could simply bounce off like it
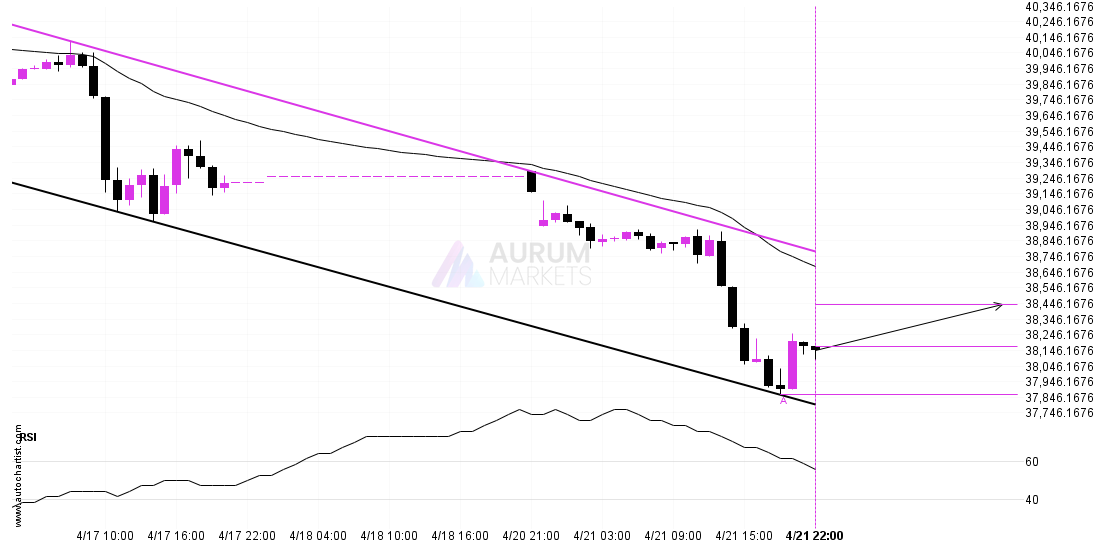
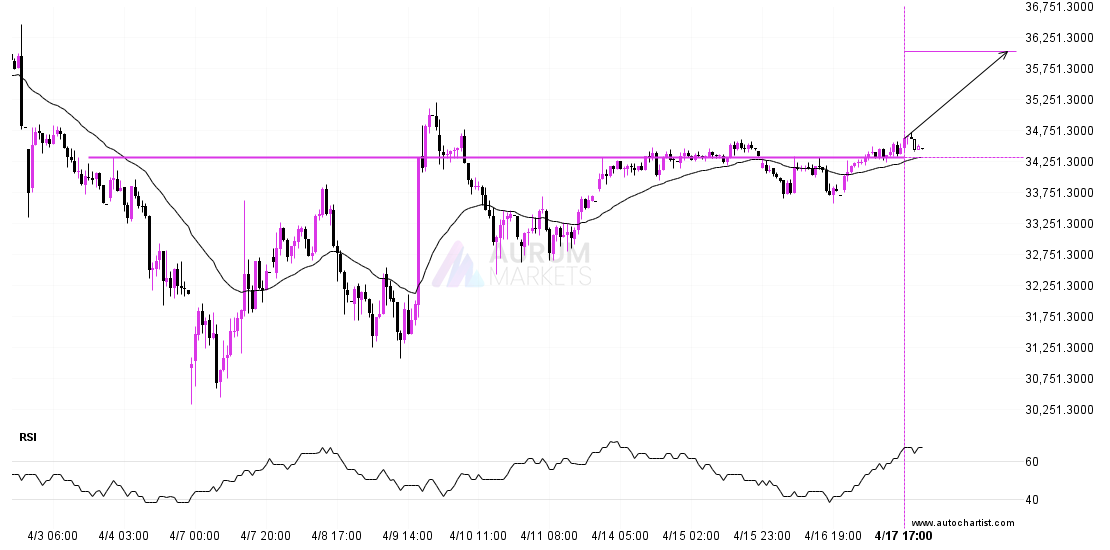
DOW 30 is approaching the resistance line of a Channel Down. It has touched this line numerous times in the last 6 days. If it tests this line again, it

USDJPY is once again retesting a key horizontal support level at 141.6130. It has tested this level 4 times in the recent past and could simply bounce off like it
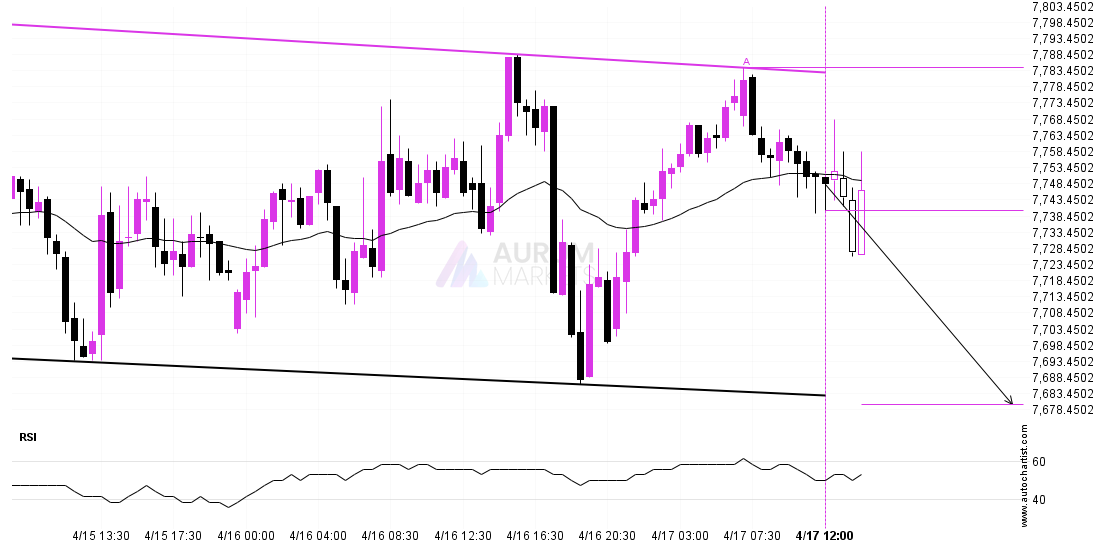
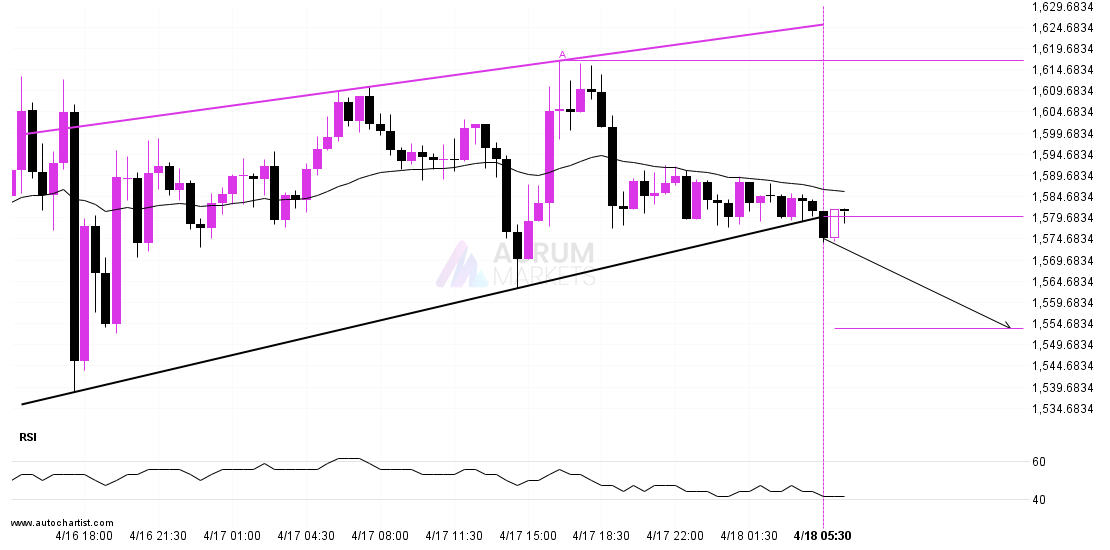
Emerging Channel Down pattern in its final wave was identified on the ASX 225 30 Minutes chart. After a strong bearish run, we find ASX 225 heading towards the upper
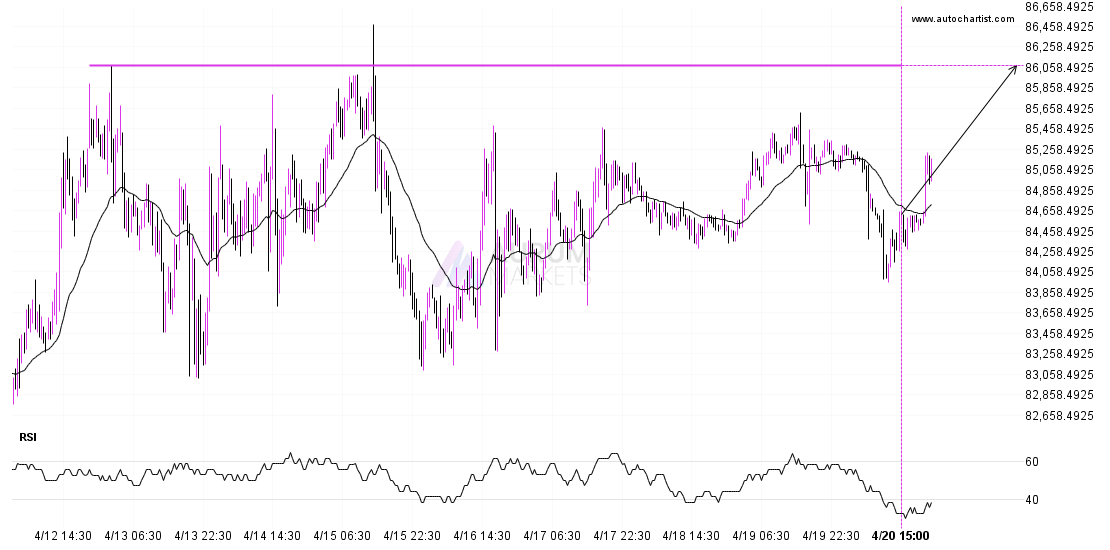
BTCUSD is heading towards 86079.4688 and could reach this point within the next 2 days. It has tested this line numerous times in the past, and this time could be
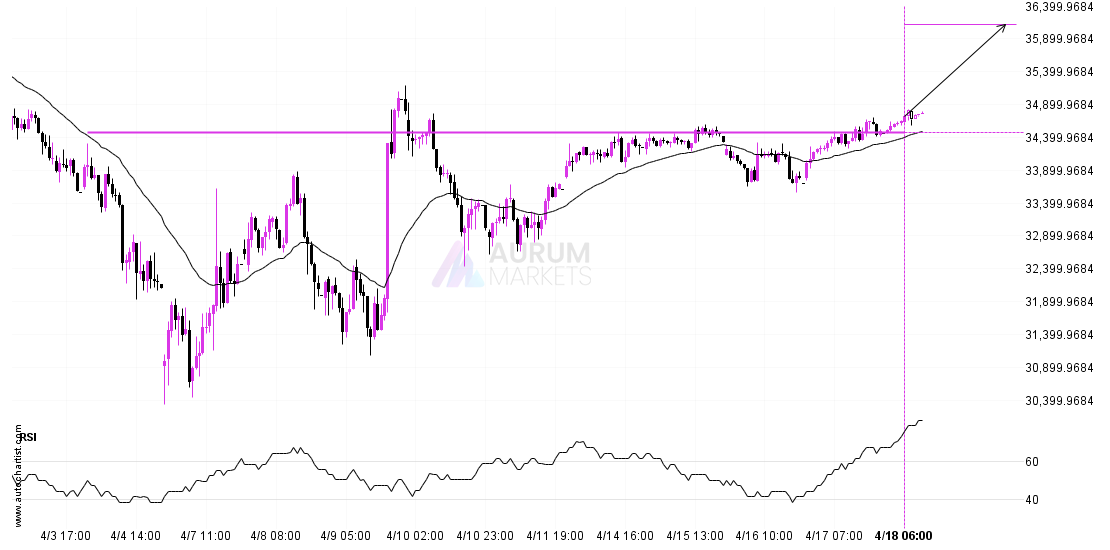
The breakout of Nikkei 225 through the 34469.0000 price line is a breach of an important psychological price that is has tested numerous in the past. If this breakout persists,
You would be well advised to confirm the breakout that has just occurred – do you believe the move through support to be significant? Do you have confirming indicators that
Nikkei 225 has broken through a line of 34312.0000 and suggests a possible movement to 36020.3984 within the next 3 days. It has tested this line numerous times in the
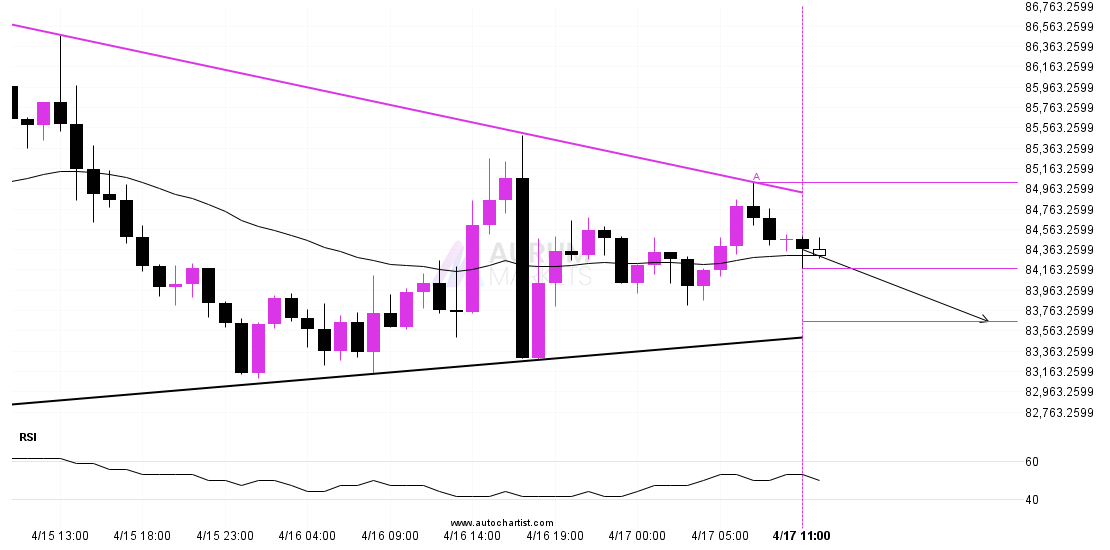
Emerging Triangle detected on BTCUSD – the pattern is an emerging one and has not yet broken through resistance, but the price is expected to move up over the next
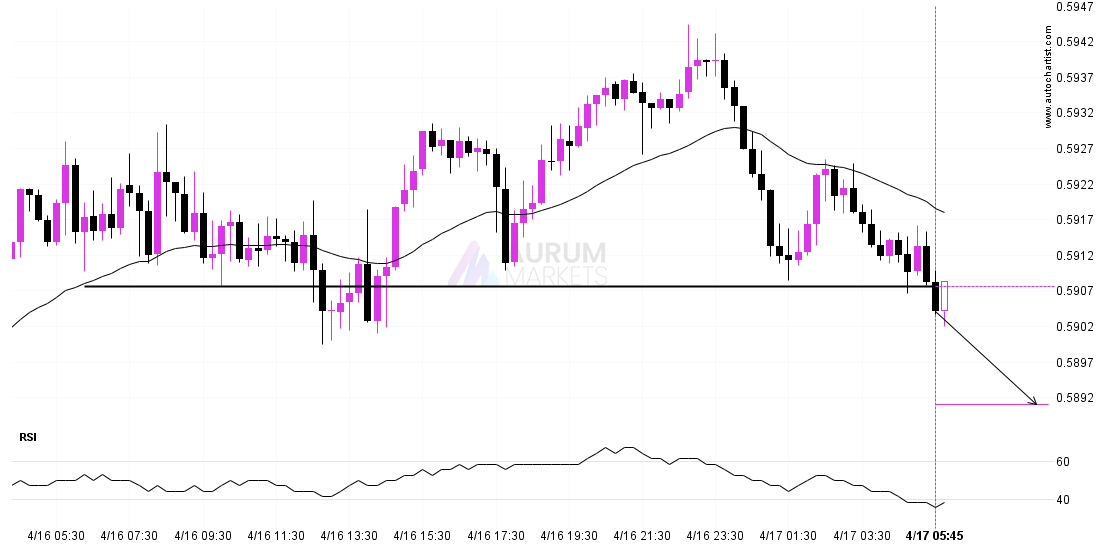
NZDUSD has broken through 0.5908 which it has tested numerous times in the past. We have seen it retrace from this price in the past. If this new trend persists,