Skip to contentSkip to content
Aurum Markets Blog
  • Home
  • Technical Analysis
  • Market Insights
  • Client & IB Login
  • Register
Close Button

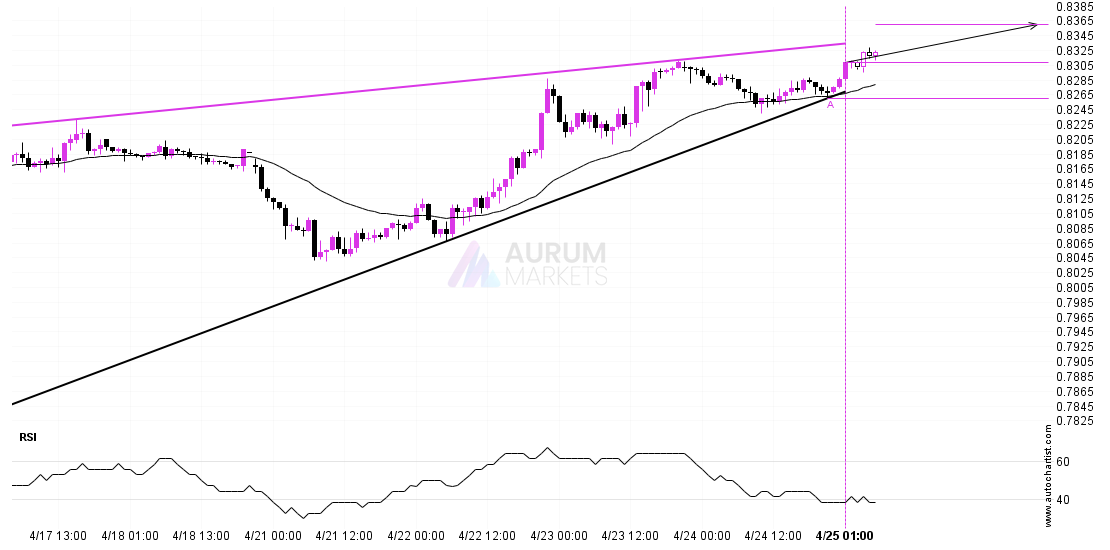
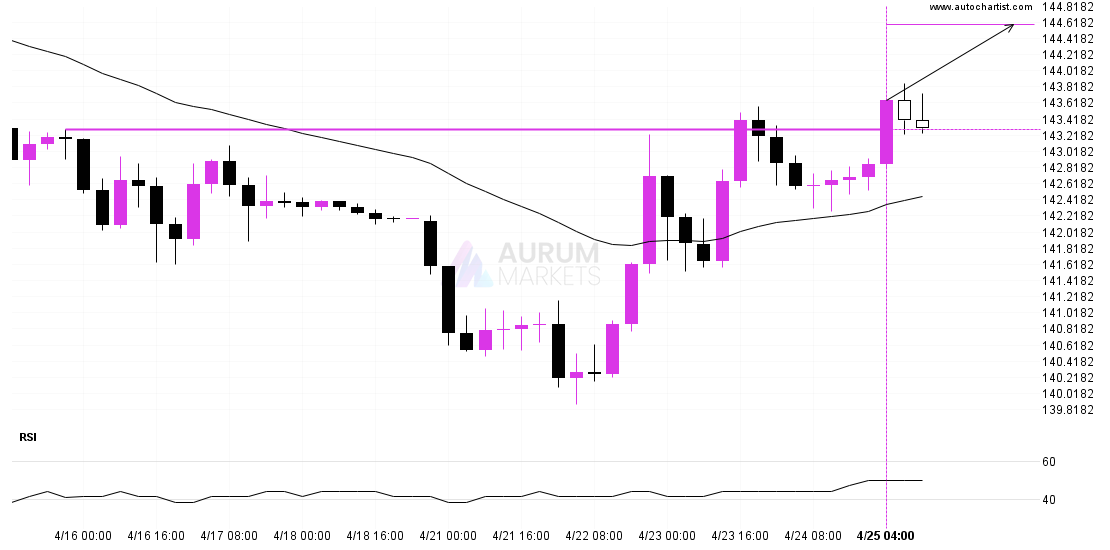
USDJPY – psychological price line breachedUSDJPY – psychological price line breached

April 25, 2025April 25, 2025| admin-aurumadmin-aurum| 0 Comment| 11:15 am

A strong resistance level has been breached at 143.2840 on the 4 hour USDJPY chart. Technical Analysis theory forecasts a movement to 144.5834 in the next day. Supported by Upward

Read MoreRead More

Should we expect a breakout or a rebound on USDCHF?Should we expect a breakout or a rebound on USDCHF?

April 25, 2025April 25, 2025| admin-aurumadmin-aurum| 0 Comment| 6:16 am

USDCHF is heading towards the resistance line of a Rising Wedge and could reach this point within the next 2 days. It has tested this line numerous times in the

Read MoreRead More

Resistance breakout on Nikkei 225Resistance breakout on Nikkei 225

April 24, 2025April 24, 2025| admin-aurumadmin-aurum| 0 Comment| 10:16 pm

Nikkei 225 has broken through a resistance line. It has touched this line numerous times in the last 2 days. This breakout shows a potential move to 35822.0000 within the

Read MoreRead More

A potential bullish movement on NZDUSDA potential bullish movement on NZDUSD

April 24, 2025April 24, 2025| admin-aurumadmin-aurum| 0 Comment| 11:17 am

A Triangle pattern was identified on NZDUSD at 0.597295, creating an expectation that it may move to the resistance line at 0.5995. It may break through that line and continue

Read MoreRead More

EURUSD approaching important level of 1.1296EURUSD approaching important level of 1.1296

April 24, 2025April 24, 2025| admin-aurumadmin-aurum| 0 Comment| 6:12 am

EURUSD is moving towards a key support level at 1.1296. EURUSD has previously tested this level 4 times and on each occasion it has bounced back off this level. Is

Read MoreRead More

Either a rebound or a breakout imminent on ASX 225Either a rebound or a breakout imminent on ASX 225

April 23, 2025April 23, 2025| admin-aurumadmin-aurum| 0 Comment| 10:16 pm

ASX 225 is moving towards a support line. Because we have seen it retrace from this line before, we could see either a break through this line, or a rebound

Read MoreRead More

A final push possible on NZDUSDA final push possible on NZDUSD

April 23, 2025April 23, 2025| admin-aurumadmin-aurum| 0 Comment| 11:15 am

NZDUSD is heading towards 0.5974 and could reach this point within the next 7 hours. It has tested this line numerous times in the past, and this time could be

Read MoreRead More

A possible start of a bullish trend on USDJPYA possible start of a bullish trend on USDJPY

April 23, 2025April 23, 2025| admin-aurumadmin-aurum| 0 Comment| 6:16 am

USDJPY has broken through a resistance line of a Falling Wedge and suggests a possible movement to 143.4140 within the next 3 days. It has tested this line in the

Read MoreRead More

DAX 40 approaching important level of 21581.6992DAX 40 approaching important level of 21581.6992

April 22, 2025April 22, 2025| admin-aurumadmin-aurum| 0 Comment| 10:16 pm

The price of DAX 40 in heading back to the resistance area. It is possible that it will struggle to break through it and move back in the other direction.

Read MoreRead More

A possible start of a bullish trend on USDCADA possible start of a bullish trend on USDCAD

April 22, 2025April 22, 2025| admin-aurumadmin-aurum| 0 Comment| 11:16 am

USDCAD moved through the resistance line of a Falling Wedge at 1.381794705882353 on the 4 hour chart. This line has been tested a number of times in the past and

Read MoreRead More

Posts pagination

Previous 1 … 37 38 39 … 55 Next

Recent Posts

  • 3 Point Extension Fibonacci pattern identified at 12/27 14:30. Possible bearish price movement towards target levels ranging from 454.50 to 311.16 within the next 10 days.
  • US30 Dow Jones Industrial Average Index is approaching an important level at 48456.12
  • A potential bearish move in FRA40 CAC 40 French Index
  • Trade outlook for EURAUD from 2025-12-22 05:00:00.000 until 2025-12-22 05:00:00.000
  • Gartley Fibonacci pattern identified at 12/19 14:30. This pattern is still in the process of forming. Possible bearish price movement towards target levels ranging from 238.54 to 203.78 within the next 12 days.

Recent Comments

No comments to show.
  • Technical Analysis

Search

Archives

  • December 2025
  • November 2025
  • October 2025
  • September 2025
  • August 2025
  • July 2025
  • June 2025
  • May 2025
  • April 2025
  • March 2025
  • February 2025
  • January 2025

Meta

  • Register
  • Log in

Categories

  • Technical Analysis

Educational Landing Page WordPress Theme Copyright @ 2025 Aurum Markets Limited

Back To Top