Skip to contentSkip to content
Aurum Markets Blog
  • Home
  • Technical Analysis
  • Market Insights
  • Client & IB Login
  • Register
Close Button

A potential bullish movement on AUDUSDA potential bullish movement on AUDUSD

May 6, 2025May 6, 2025| admin-aurumadmin-aurum| 0 Comment| 6:16 am

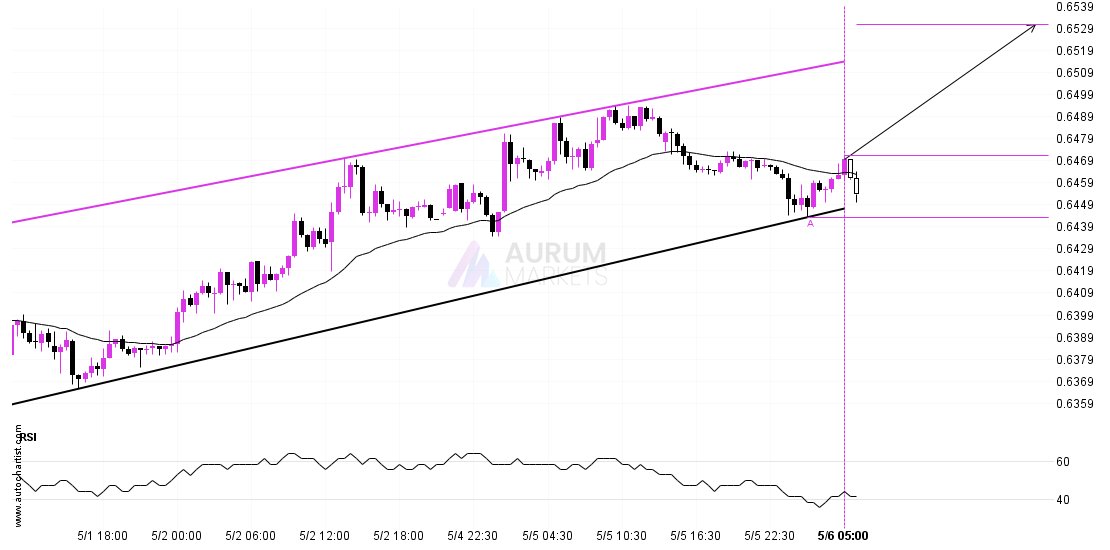
AUDUSD is moving towards a resistance line which it has tested numerous times in the past. We have seen it retrace from this line before, so at this stage it

Read MoreRead More

A potential bullish movement on BTCUSDA potential bullish movement on BTCUSD

May 5, 2025May 5, 2025| admin-aurumadmin-aurum| 0 Comment| 10:16 pm

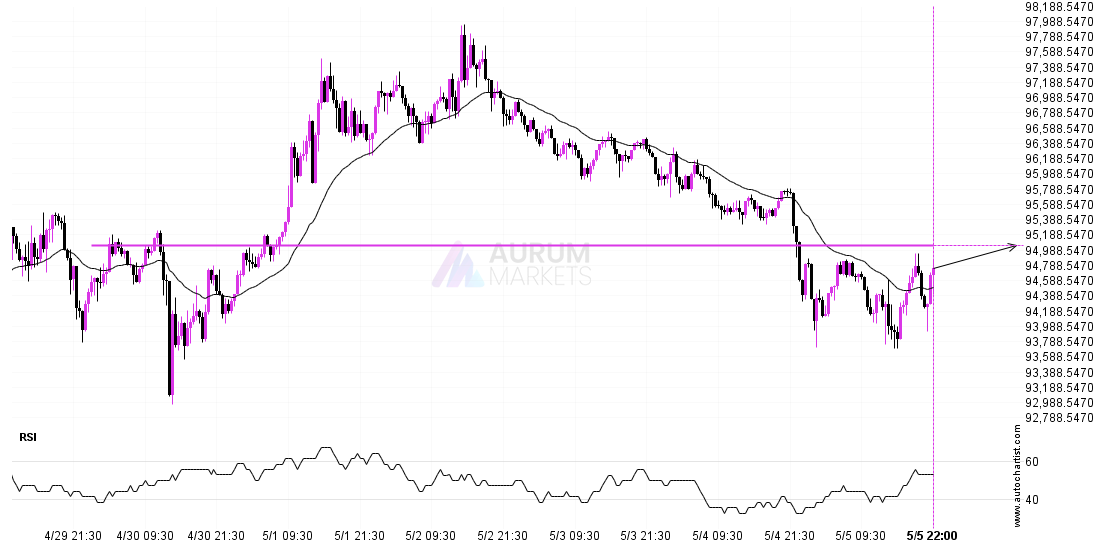
BTCUSD is moving towards a key resistance level at 95047.4688. This is a previously tested level for BTCUSD. This could be a good trading opportunity, either at the spot price,

Read MoreRead More

Either a rebound or a breakout imminent on ETHUSDEither a rebound or a breakout imminent on ETHUSD

May 5, 2025May 5, 2025| admin-aurumadmin-aurum| 0 Comment| 11:17 am

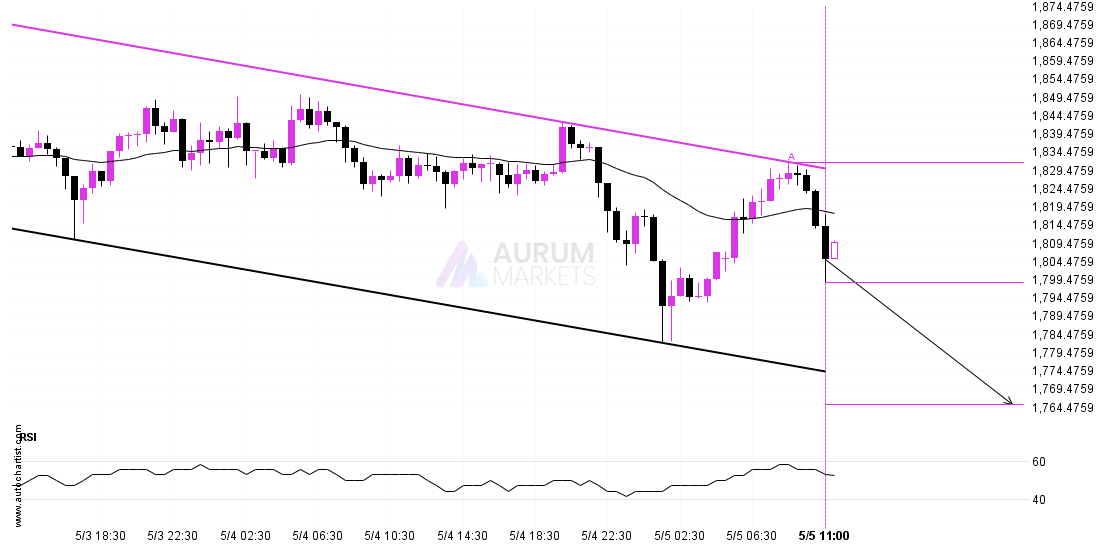
ETHUSD is heading towards the support line of a Channel Down and could reach this point within the next 13 hours. It has tested this line numerous times in the

Read MoreRead More

USDCHF approaching important bullish key levelUSDCHF approaching important bullish key level

May 5, 2025May 5, 2025| admin-aurumadmin-aurum| 0 Comment| 6:14 am

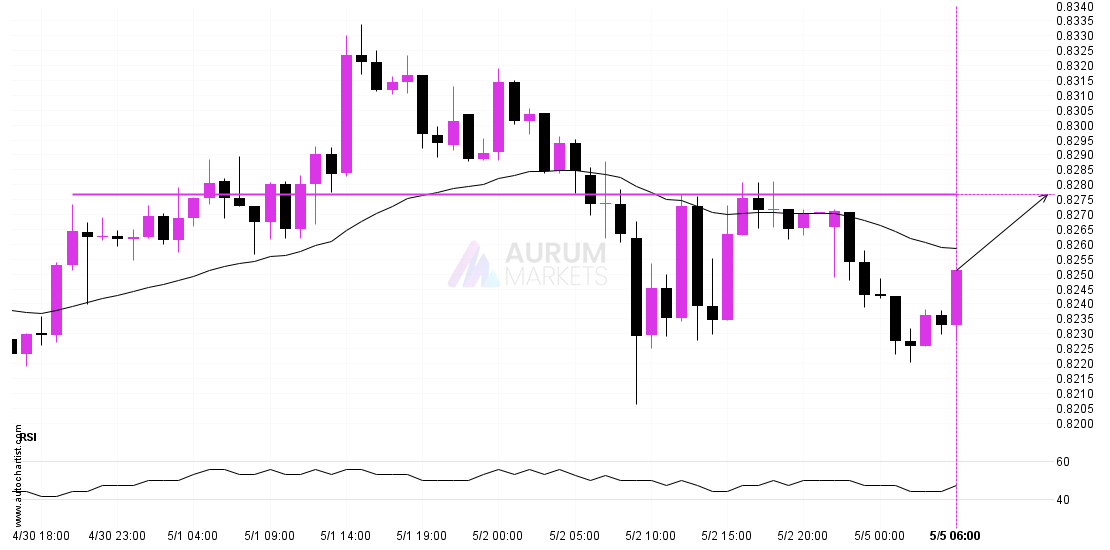
USDCHF is approaching a resistance line at 0.8276. If it hits the resistance line, it may break through this level to continue the bullish trend, or it may turn around

Read MoreRead More

Possible breach of resistance level by USDCADPossible breach of resistance level by USDCAD

May 4, 2025May 4, 2025| admin-aurumadmin-aurum| 0 Comment| 10:16 pm

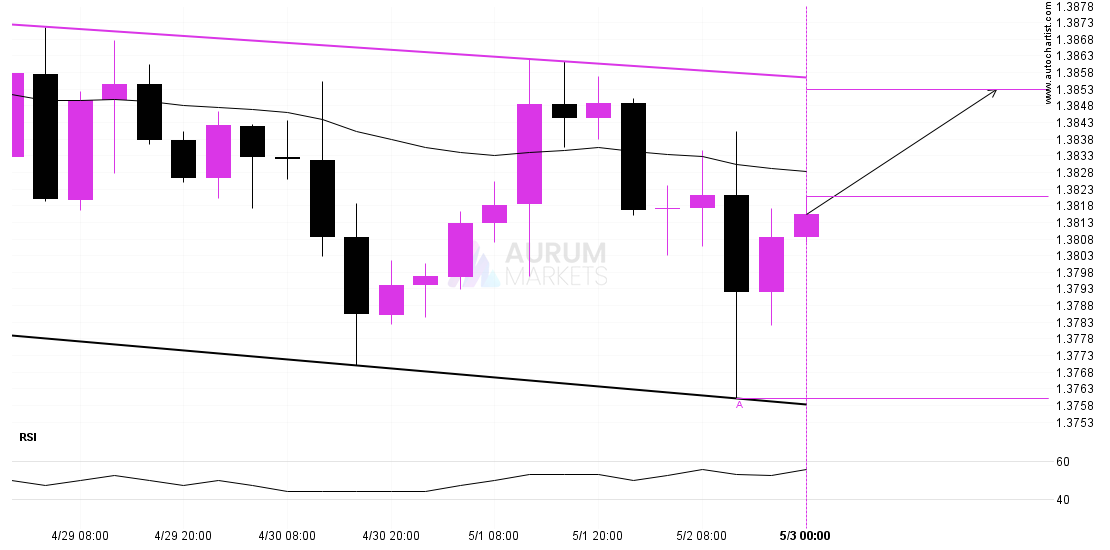
A Channel Down pattern was identified on USDCAD at 1.38207, creating an expectation that it may move to the resistance line at 1.3853. It may break through that line and

Read MoreRead More

A potential bearish movement on USDCHFA potential bearish movement on USDCHF

May 2, 2025May 2, 2025| admin-aurumadmin-aurum| 0 Comment| 11:19 am

USDCHF is heading towards 0.8183 and could reach this point within the next 3 days. It has tested this line numerous times in the past, and this time could be

Read MoreRead More

Nikkei 225 – Reversal Chart Pattern – Channel UpNikkei 225 – Reversal Chart Pattern – Channel Up

May 2, 2025May 2, 2025| admin-aurumadmin-aurum| 0 Comment| 6:16 am

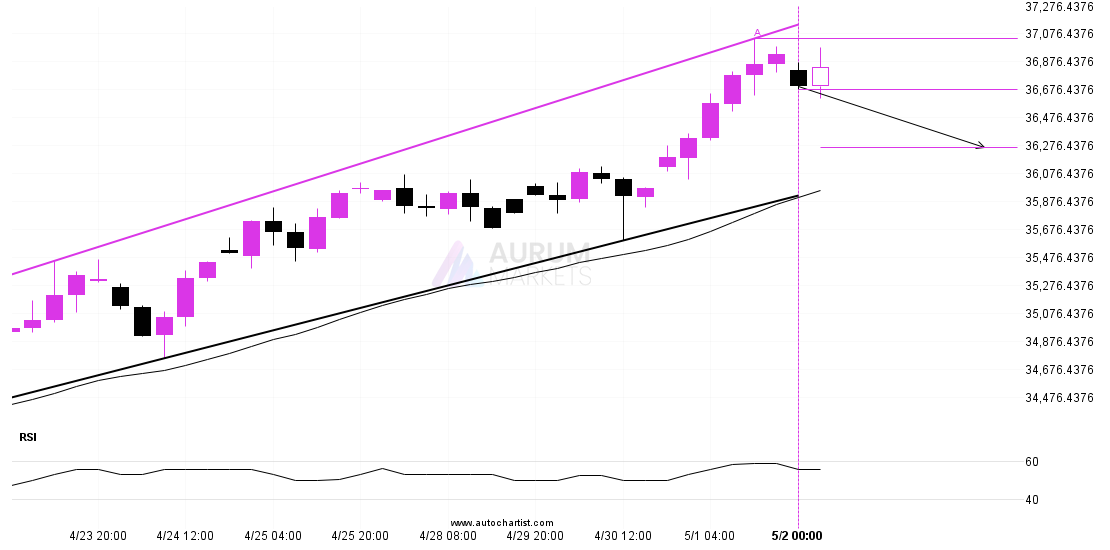
Nikkei 225 is moving towards a support line which it has tested numerous times in the past. We have seen it retrace from this line before, so at this stage

Read MoreRead More

A potential bullish movement on USDCADA potential bullish movement on USDCAD

May 1, 2025May 1, 2025| admin-aurumadmin-aurum| 0 Comment| 10:17 pm

USDCAD is moving towards a key resistance level at 1.3911. USDCAD has previously tested this level 3 times and on each occasion it has bounced back off this level. Is

Read MoreRead More

USDCHF approaching resistance of a Rising WedgeUSDCHF approaching resistance of a Rising Wedge

May 1, 2025May 1, 2025| admin-aurumadmin-aurum| 0 Comment| 11:17 am

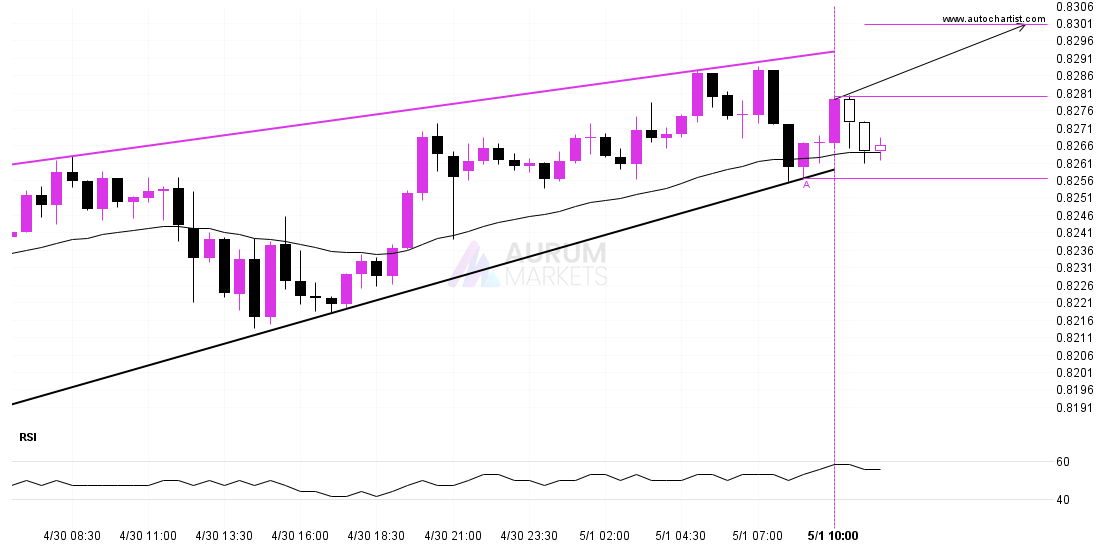
USDCHF is heading towards the resistance line of a Rising Wedge and could reach this point within the next 6 hours. It has tested this line numerous times in the

Read MoreRead More

DOW 30 breakout through resistanceDOW 30 breakout through resistance

May 1, 2025May 1, 2025| admin-aurumadmin-aurum| 0 Comment| 6:15 am

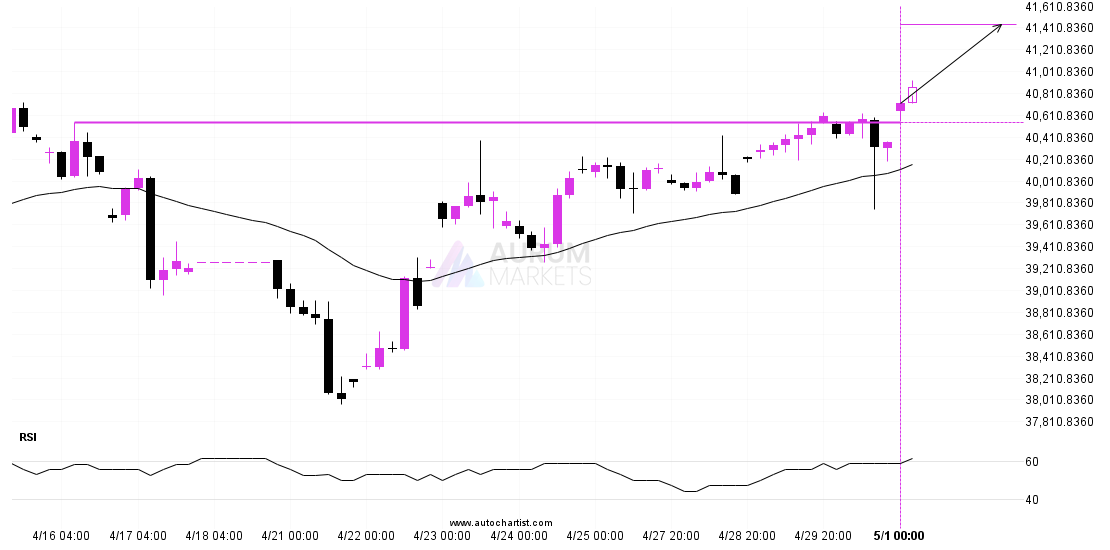
A strong resistance level has been breached at 40545.9414 on the 4 hour DOW 30 chart. Technical Analysis theory forecasts a movement to 41437.6172 in the next 2 days. Supported

Read MoreRead More

Posts pagination

Previous 1 … 35 36 37 … 55 Next

Recent Posts

  • 3 Point Extension Fibonacci pattern identified at 12/27 14:30. Possible bearish price movement towards target levels ranging from 454.50 to 311.16 within the next 10 days.
  • US30 Dow Jones Industrial Average Index is approaching an important level at 48456.12
  • A potential bearish move in FRA40 CAC 40 French Index
  • Trade outlook for EURAUD from 2025-12-22 05:00:00.000 until 2025-12-22 05:00:00.000
  • Gartley Fibonacci pattern identified at 12/19 14:30. This pattern is still in the process of forming. Possible bearish price movement towards target levels ranging from 238.54 to 203.78 within the next 12 days.

Recent Comments

No comments to show.
  • Technical Analysis

Search

Archives

  • December 2025
  • November 2025
  • October 2025
  • September 2025
  • August 2025
  • July 2025
  • June 2025
  • May 2025
  • April 2025
  • March 2025
  • February 2025
  • January 2025

Meta

  • Register
  • Log in

Categories

  • Technical Analysis

Educational Landing Page WordPress Theme Copyright @ 2025 Aurum Markets Limited

Back To Top