Skip to contentSkip to content
Aurum Markets Blog
  • Home
  • Technical Analysis
  • Market Insights
  • Client & IB Login
  • Register
Close Button

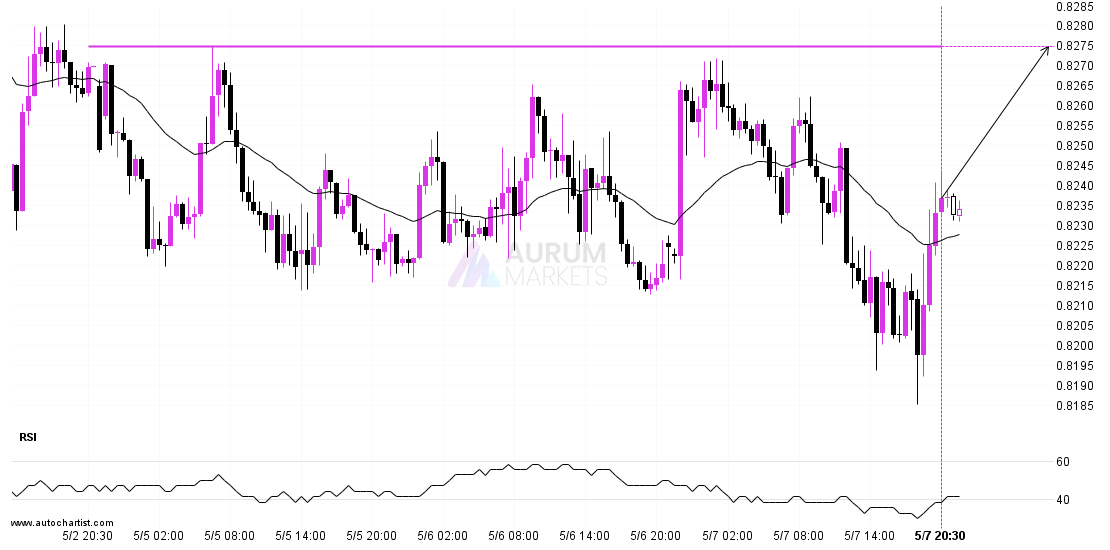
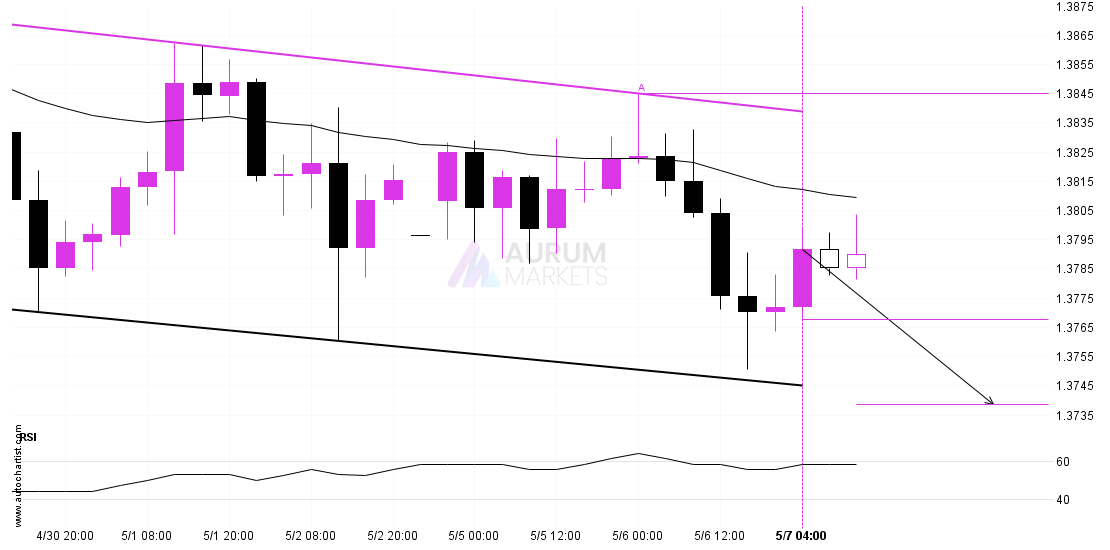
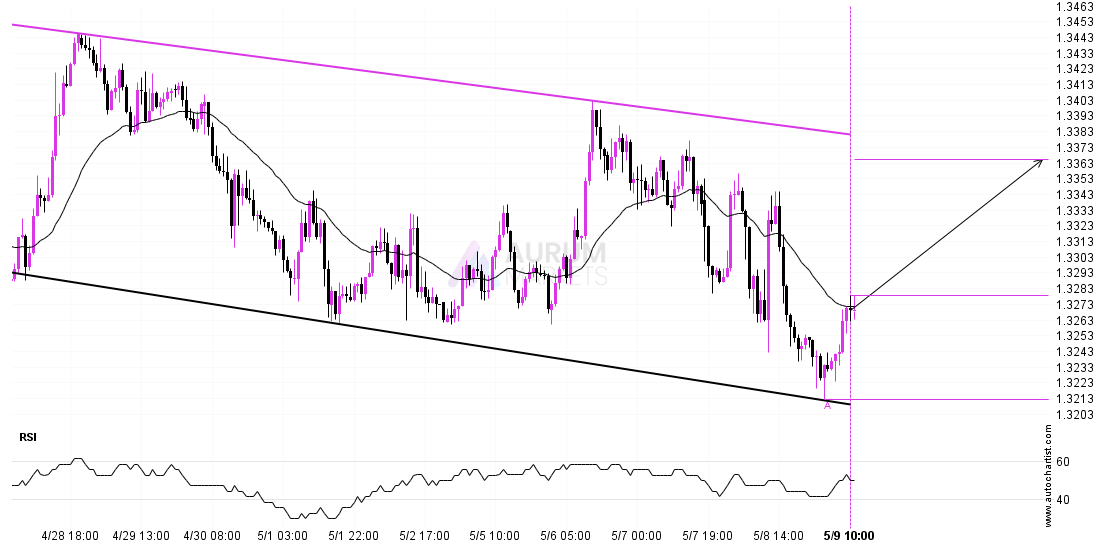
GBPUSD – getting close to resistance of a Channel DownGBPUSD – getting close to resistance of a Channel Down

May 9, 2025May 9, 2025| admin-aurumadmin-aurum| 0 Comment| 11:16 am

GBPUSD is approaching the resistance line of a Channel Down. It has touched this line numerous times in the last 15 days. If it tests this line again, it should

Read MoreRead More

Breach of important price line imminent by FTSE 100Breach of important price line imminent by FTSE 100

May 9, 2025May 9, 2025| admin-aurumadmin-aurum| 0 Comment| 6:16 am

The movement of FTSE 100 towards 8430.2803 price line is yet another test of the line it reached numerous times in the past. We could expect this test to happen

Read MoreRead More

Nikkei 225 – Continuation Chart Pattern – Channel UpNikkei 225 – Continuation Chart Pattern – Channel Up

May 8, 2025May 8, 2025| admin-aurumadmin-aurum| 0 Comment| 10:16 pm

A Channel Up pattern was identified on Nikkei 225 at 37654.0, creating an expectation that it may move to the resistance line at 38709.7955. It may break through that line

Read MoreRead More

Should we expect a bullish trend on DAX 40?Should we expect a bullish trend on DAX 40?

May 8, 2025May 8, 2025| admin-aurumadmin-aurum| 0 Comment| 11:16 am

DAX 40 has broken through a line of 23384.3008 and suggests a possible movement to 23564.3906 within the next 9 hours. It has tested this line numerous times in the

Read MoreRead More

A potential bearish movement on ASX 225A potential bearish movement on ASX 225

May 8, 2025May 8, 2025| admin-aurumadmin-aurum| 0 Comment| 6:15 am

ASX 225 is heading towards the support line of a Rising Wedge. If this movement continues, the price of ASX 225 could test 8148.0250 within the next 5 hours. It

Read MoreRead More

Breach of important price line imminent by USDCHFBreach of important price line imminent by USDCHF

May 7, 2025May 7, 2025| admin-aurumadmin-aurum| 0 Comment| 10:16 pm

USDCHF is moving towards a key resistance level at 0.8275. USDCHF has previously tested this level 4 times and on each occasion it has bounced back off this level. Is

Read MoreRead More

Should we expect a breakout or a rebound on USDCAD?Should we expect a breakout or a rebound on USDCAD?

May 7, 2025May 7, 2025| admin-aurumadmin-aurum| 0 Comment| 11:16 am

USDCAD was identified at around 1.376775 having recently rebounded of the resistance on the 4 hour data interval. Ultimately, the price action of the stock has formed a Channel Down

Read MoreRead More

Confirmed breakout on ASX 225 30 Minutes chartConfirmed breakout on ASX 225 30 Minutes chart

May 7, 2025May 7, 2025| admin-aurumadmin-aurum| 0 Comment| 6:14 am

ASX 225 has broken through 8138.0000 which it has tested numerous times in the past. We have seen it retrace from this price in the past. If this new trend

Read MoreRead More

Continuation pattern on BTCUSDContinuation pattern on BTCUSD

May 6, 2025May 6, 2025| admin-aurumadmin-aurum| 0 Comment| 10:17 pm

BTCUSD has broken through the support line which it has tested twice in the past. We have seen it retrace from this line before, so one should wait for confirmation

Read MoreRead More

EURUSD short term bearish trade setup to 1.1304EURUSD short term bearish trade setup to 1.1304

May 6, 2025May 6, 2025| admin-aurumadmin-aurum| 0 Comment| 11:16 am

EURUSD is moving towards a key support level at 1.1304. This is a previously tested level for EURUSD. This could be a good trading opportunity, either at the spot price,

Read MoreRead More

Posts pagination

Previous 1 … 34 35 36 … 55 Next

Recent Posts

  • 3 Point Extension Fibonacci pattern identified at 12/27 14:30. Possible bearish price movement towards target levels ranging from 454.50 to 311.16 within the next 10 days.
  • US30 Dow Jones Industrial Average Index is approaching an important level at 48456.12
  • A potential bearish move in FRA40 CAC 40 French Index
  • Trade outlook for EURAUD from 2025-12-22 05:00:00.000 until 2025-12-22 05:00:00.000
  • Gartley Fibonacci pattern identified at 12/19 14:30. This pattern is still in the process of forming. Possible bearish price movement towards target levels ranging from 238.54 to 203.78 within the next 12 days.

Recent Comments

No comments to show.
  • Technical Analysis

Search

Archives

  • December 2025
  • November 2025
  • October 2025
  • September 2025
  • August 2025
  • July 2025
  • June 2025
  • May 2025
  • April 2025
  • March 2025
  • February 2025
  • January 2025

Meta

  • Register
  • Log in

Categories

  • Technical Analysis

Educational Landing Page WordPress Theme Copyright @ 2025 Aurum Markets Limited

Back To Top