Skip to contentSkip to content
Aurum Markets Blog
  • Home
  • Technical Analysis
  • Market Insights
  • Client & IB Login
  • Register
Close Button

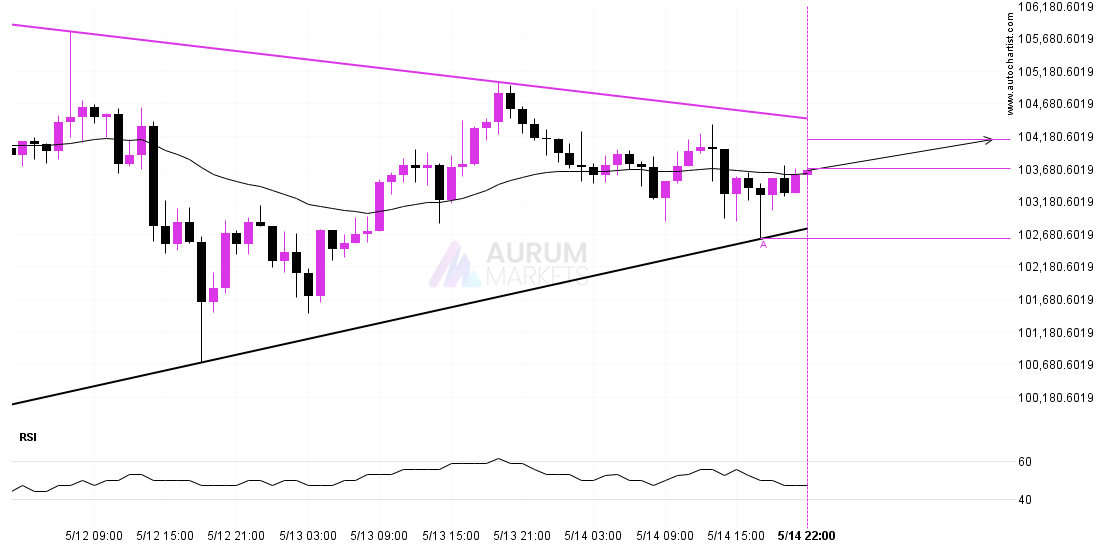
Will BTCUSD have enough momentum to break resistance?Will BTCUSD have enough momentum to break resistance?

May 14, 2025May 14, 2025| admin-aurumadmin-aurum| 0 Comment| 10:16 pm

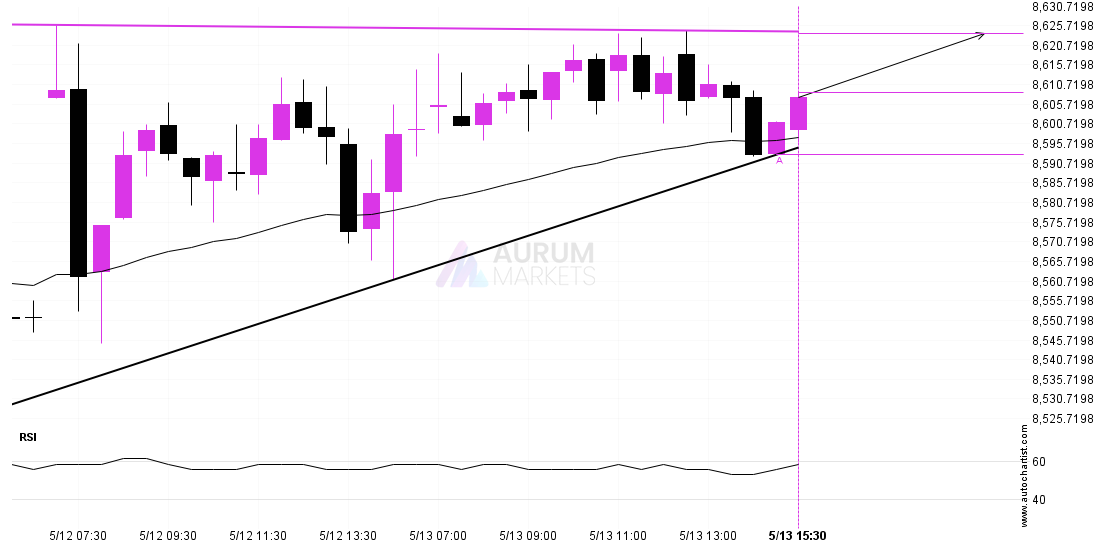
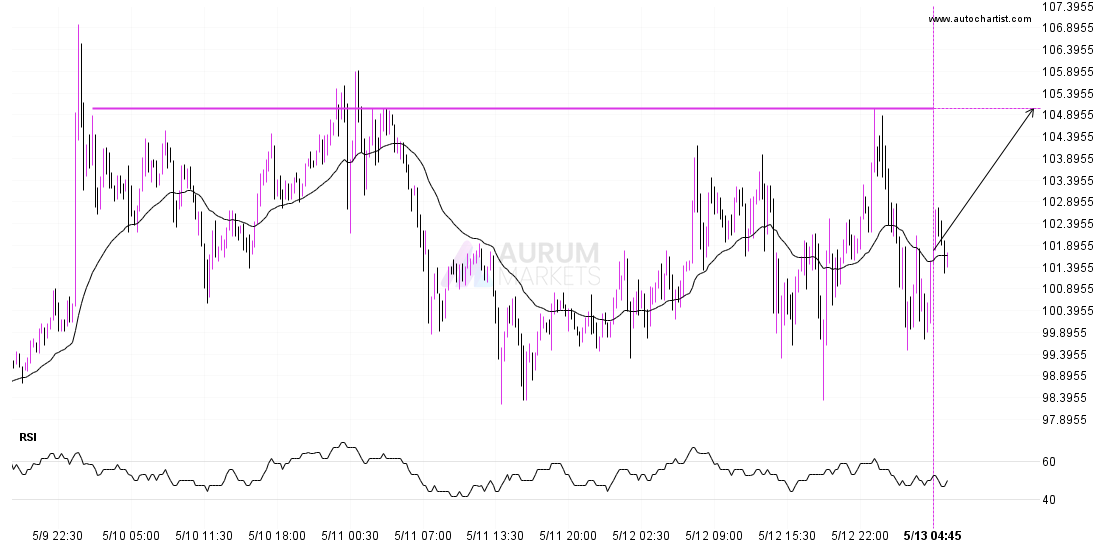
Emerging Triangle detected on BTCUSD – the pattern is an emerging one and has not yet broken through support, but the price is expected to move up over the next

Read MoreRead More

USDJPY approaches important level of 144.7020USDJPY approaches important level of 144.7020

May 14, 2025May 14, 2025| admin-aurumadmin-aurum| 0 Comment| 11:16 am

USDJPY is moving towards a key support level at 144.7020. USDJPY has previously tested this level 3 times and on each occasion it has bounced back off this level. Is

Read MoreRead More

FTSE 100 approaching resistance of a Ascending TriangleFTSE 100 approaching resistance of a Ascending Triangle

May 14, 2025May 14, 2025| admin-aurumadmin-aurum| 0 Comment| 6:14 am

Emerging Ascending Triangle detected on FTSE 100 – the pattern is an emerging one and has not yet broken through support, but the price is expected to move up over

Read MoreRead More

DAX 40 short term bearish trade setup to 23579.0000DAX 40 short term bearish trade setup to 23579.0000

May 13, 2025May 13, 2025| admin-aurumadmin-aurum| 0 Comment| 10:16 pm

DAX 40 is approaching a support line at 23579.0000. If it hits the support line, it may break through this level to continue the bearish trend, or it may turn

Read MoreRead More

USDCAD – getting close to resistance of a Rising WedgeUSDCAD – getting close to resistance of a Rising Wedge

May 13, 2025May 13, 2025| admin-aurumadmin-aurum| 0 Comment| 11:17 am

USDCAD is moving towards a resistance line which it has tested numerous times in the past. We have seen it retrace from this line before, so at this stage it

Read MoreRead More

A final push possible on LTCUSDA final push possible on LTCUSD

May 13, 2025May 13, 2025| admin-aurumadmin-aurum| 0 Comment| 6:15 am

LTCUSD is approaching a resistance line at 105.0400. If it hits the resistance line, it may break through this level to continue the bullish trend, or it may turn around

Read MoreRead More

bullish technical pattern on FTSE 100 15 Minutesbullish technical pattern on FTSE 100 15 Minutes

May 12, 2025May 12, 2025| admin-aurumadmin-aurum| 0 Comment| 10:16 pm

The last 5 15 Minutes candles on FTSE 100 formed a Triangle pattern and broken out through the pattern lines, indicating a possible bullish movement towards the price level of

Read MoreRead More

FTSE 100 is on the approachFTSE 100 is on the approach

May 12, 2025May 12, 2025| admin-aurumadmin-aurum| 0 Comment| 11:16 am

FTSE 100 is moving towards a key support level at 8552.5000. FTSE 100 has previously tested this level 3 times and on each occasion it has bounced back off this

Read MoreRead More

Either a rebound or a breakout imminent on USDJPYEither a rebound or a breakout imminent on USDJPY

May 12, 2025May 12, 2025| admin-aurumadmin-aurum| 0 Comment| 6:15 am

The movement of USDJPY towards the resistance line of a Rising Wedge is yet another test of the line it reached numerous times in the past. This line test could

Read MoreRead More

FTSE 100 – getting close to psychological price lineFTSE 100 – getting close to psychological price line

May 11, 2025May 11, 2025| admin-aurumadmin-aurum| 0 Comment| 10:14 pm

FTSE 100 is en route to a very important line that will be a definite deciding factor of what is to come! We may see this trajectory continue to touch

Read MoreRead More

Posts pagination

Previous 1 … 33 34 35 … 55 Next

Recent Posts

  • 3 Point Extension Fibonacci pattern identified at 12/27 14:30. Possible bearish price movement towards target levels ranging from 454.50 to 311.16 within the next 10 days.
  • US30 Dow Jones Industrial Average Index is approaching an important level at 48456.12
  • A potential bearish move in FRA40 CAC 40 French Index
  • Trade outlook for EURAUD from 2025-12-22 05:00:00.000 until 2025-12-22 05:00:00.000
  • Gartley Fibonacci pattern identified at 12/19 14:30. This pattern is still in the process of forming. Possible bearish price movement towards target levels ranging from 238.54 to 203.78 within the next 12 days.

Recent Comments

No comments to show.
  • Technical Analysis

Search

Archives

  • December 2025
  • November 2025
  • October 2025
  • September 2025
  • August 2025
  • July 2025
  • June 2025
  • May 2025
  • April 2025
  • March 2025
  • February 2025
  • January 2025

Meta

  • Register
  • Log in

Categories

  • Technical Analysis

Educational Landing Page WordPress Theme Copyright @ 2025 Aurum Markets Limited

Back To Top