Skip to contentSkip to content
Aurum Markets Blog
  • Home
  • Technical Analysis
  • Market Insights
  • Client & IB Login
  • Register
Close Button

ASX 225 approaching support of a TriangleASX 225 approaching support of a Triangle

May 23, 2025May 23, 2025| admin-aurumadmin-aurum| 0 Comment| 11:17 am

A Triangle pattern was identified on ASX 225 at 8321.0, creating an expectation that it may move to the support line at 8293.2427. It may break through that line and

Read MoreRead More

EURUSD approaching resistance levelEURUSD approaching resistance level

May 23, 2025May 23, 2025| admin-aurumadmin-aurum| 0 Comment| 6:15 am

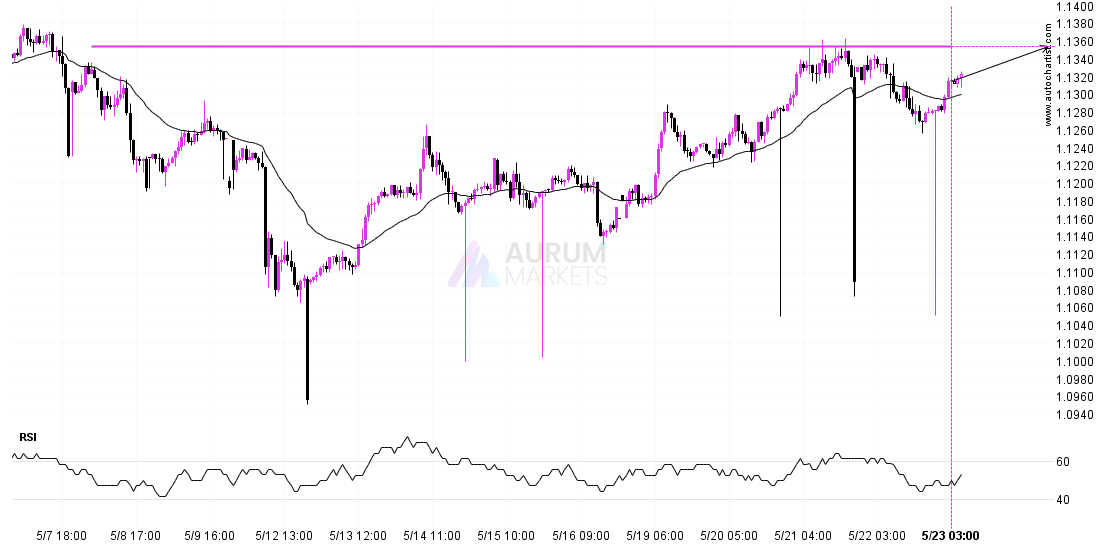
EURUSD is moving towards a key resistance level at 1.1354. This is a previously tested level for EURUSD. This could be a good trading opportunity, either at the spot price,

Read MoreRead More

Possible breach of resistance level by ASX 225Possible breach of resistance level by ASX 225

May 22, 2025May 22, 2025| admin-aurumadmin-aurum| 0 Comment| 10:16 pm

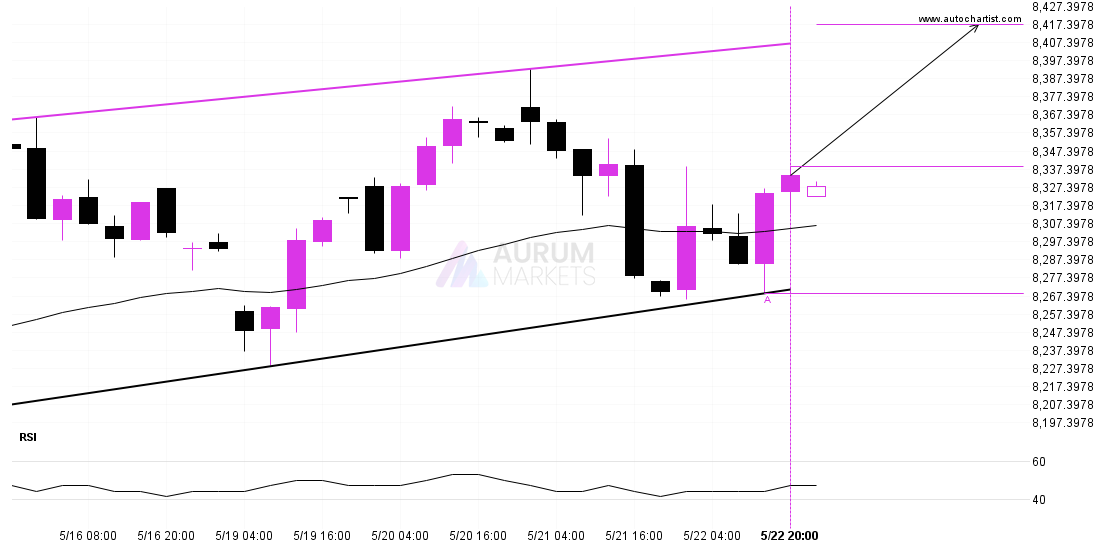
An emerging Channel Up has been detected on ASX 225 on the 4 hour chart. There is a possible move towards 8416.9408 next few candles. Once reaching support it may

Read MoreRead More

ETHUSD – psychological price line breachedETHUSD – psychological price line breached

May 22, 2025May 22, 2025| admin-aurumadmin-aurum| 0 Comment| 11:16 am

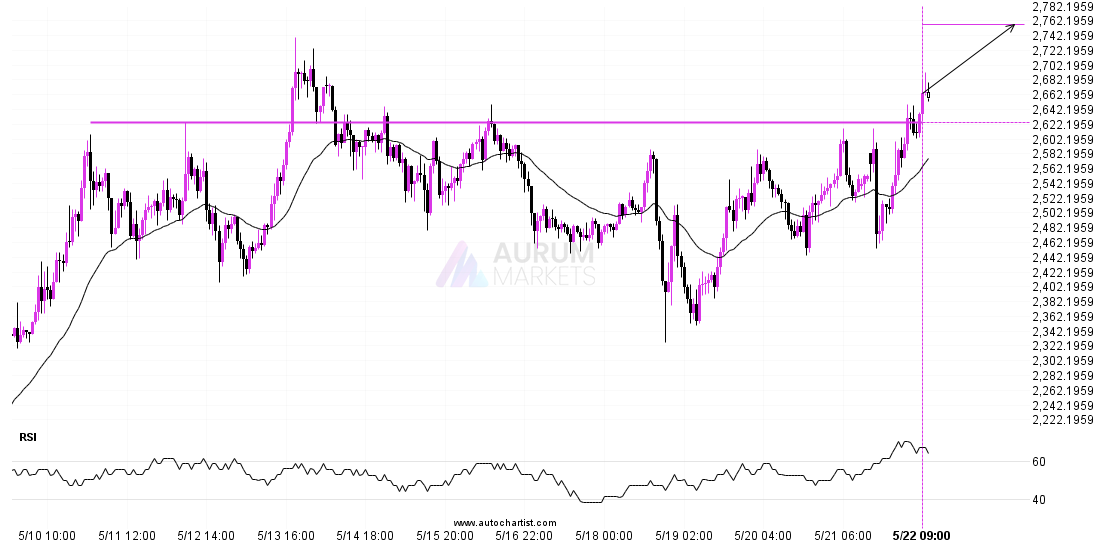
ETHUSD has breached the resistance line at 2624.3201. It may continue the bullish trend towards 2756.5439, or, it may prove to be yet another test of this level. Supported by

Read MoreRead More

AUDUSD – Continuation Chart Pattern – RectangleAUDUSD – Continuation Chart Pattern – Rectangle

May 22, 2025May 22, 2025| admin-aurumadmin-aurum| 0 Comment| 6:15 am

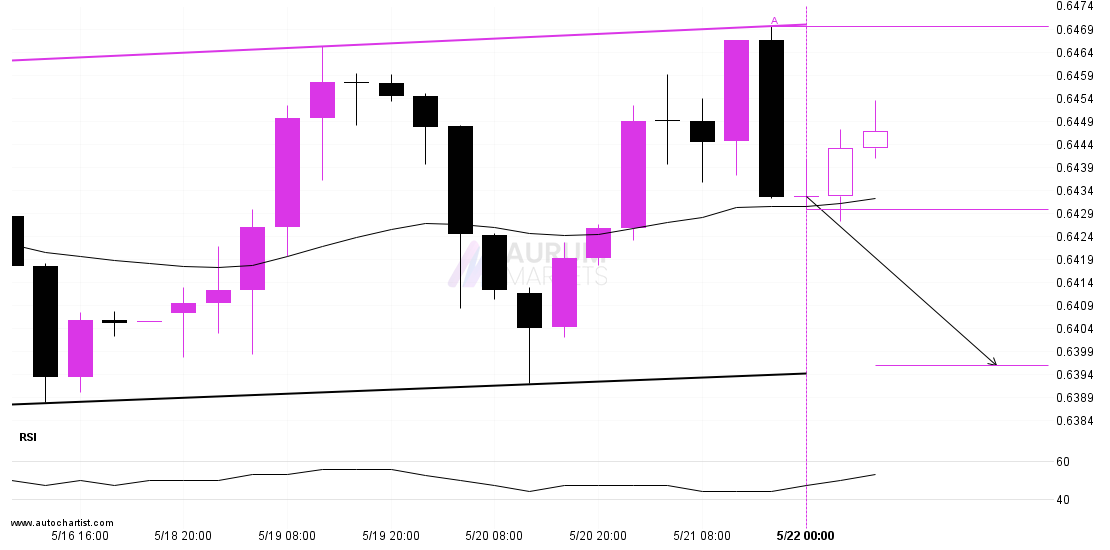
Emerging Rectangle detected on AUDUSD – the pattern is an emerging one and has not yet broken through resistance, but the price is expected to move up over the next

Read MoreRead More

ASX 225 – getting close to psychological price lineASX 225 – getting close to psychological price line

May 21, 2025May 21, 2025| admin-aurumadmin-aurum| 0 Comment| 10:15 pm

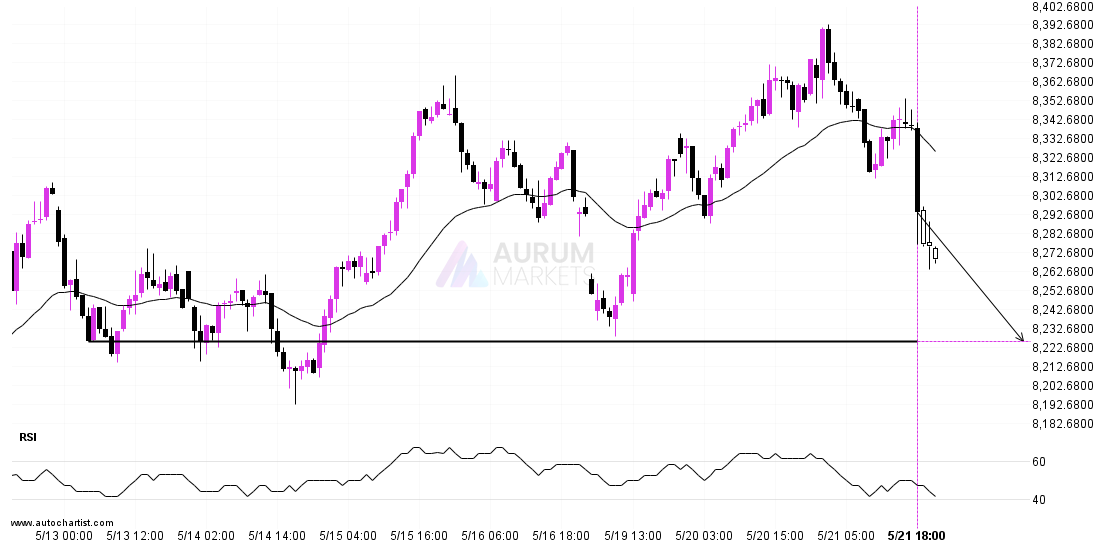
ASX 225 is approaching a support line at 8226.0000. If it hits the support line, it may break through this level to continue the bearish trend, or it may turn

Read MoreRead More

USDJPY approaching support of a Falling WedgeUSDJPY approaching support of a Falling Wedge

May 21, 2025May 21, 2025| admin-aurumadmin-aurum| 0 Comment| 11:18 am

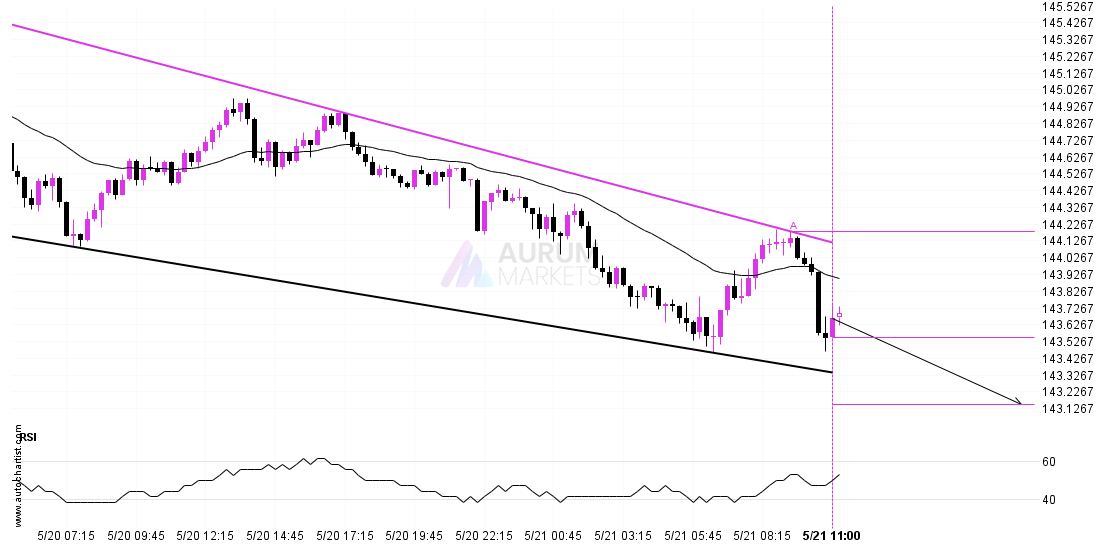
A Falling Wedge pattern was identified on USDJPY at 143.5505, creating an expectation that it may move to the support line at 143.1548. It may break through that line and

Read MoreRead More

DOW 30 approaching support levelDOW 30 approaching support level

May 21, 2025May 21, 2025| admin-aurumadmin-aurum| 0 Comment| 6:14 am

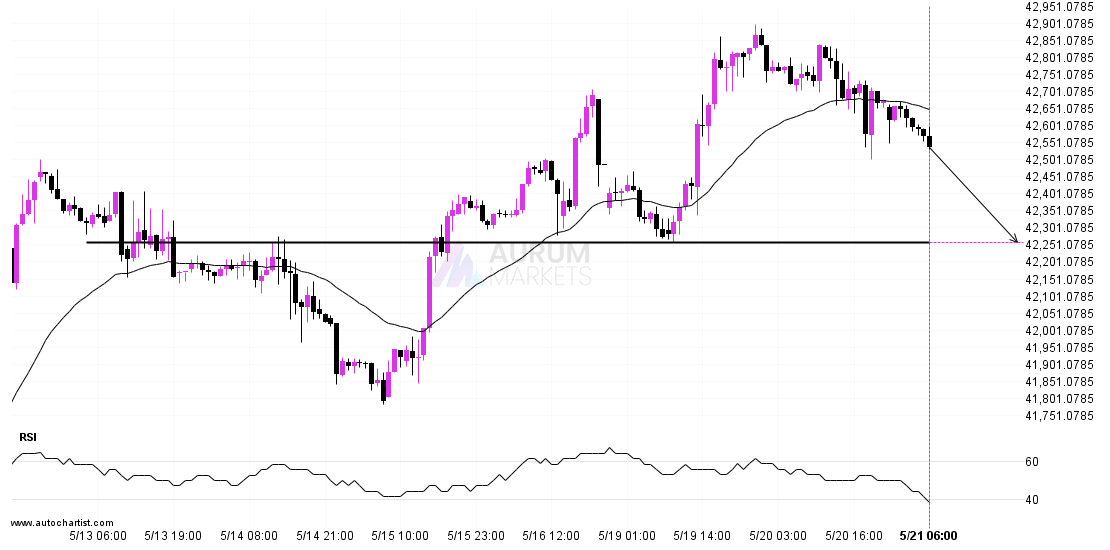
DOW 30 is heading towards 42258.9492 and could reach this point within the next 2 days. It has tested this line numerous times in the past, and this time could

Read MoreRead More

A potential bullish movement on NZDUSDA potential bullish movement on NZDUSD

May 20, 2025May 20, 2025| admin-aurumadmin-aurum| 0 Comment| 10:16 pm

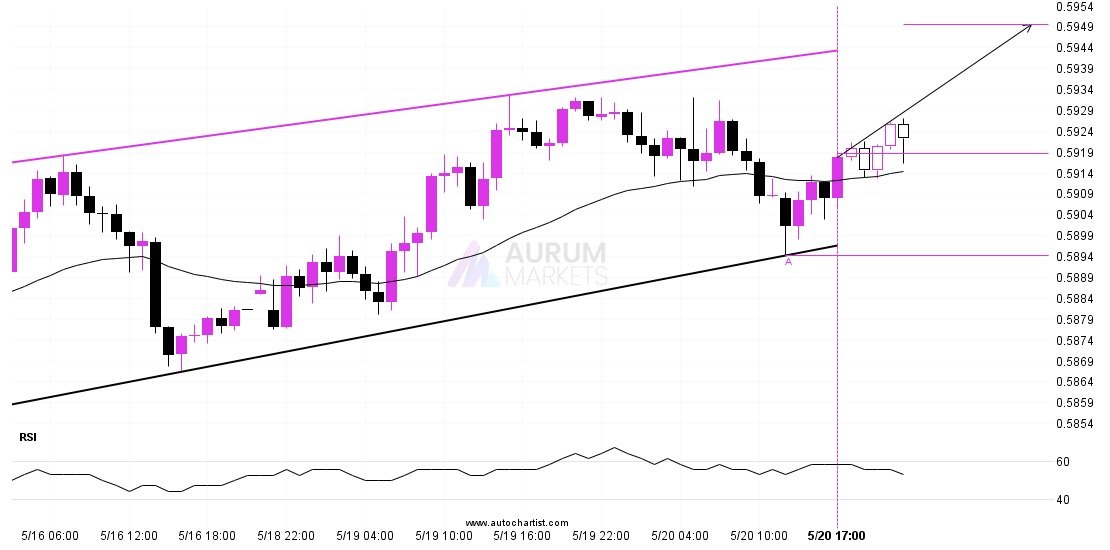
NZDUSD is heading towards the resistance line of a Channel Up and could reach this point within the next 13 hours. It has tested this line numerous times in the

Read MoreRead More

Nikkei 225 approaching important bearish key levelNikkei 225 approaching important bearish key level

May 20, 2025May 20, 2025| admin-aurumadmin-aurum| 0 Comment| 11:15 am

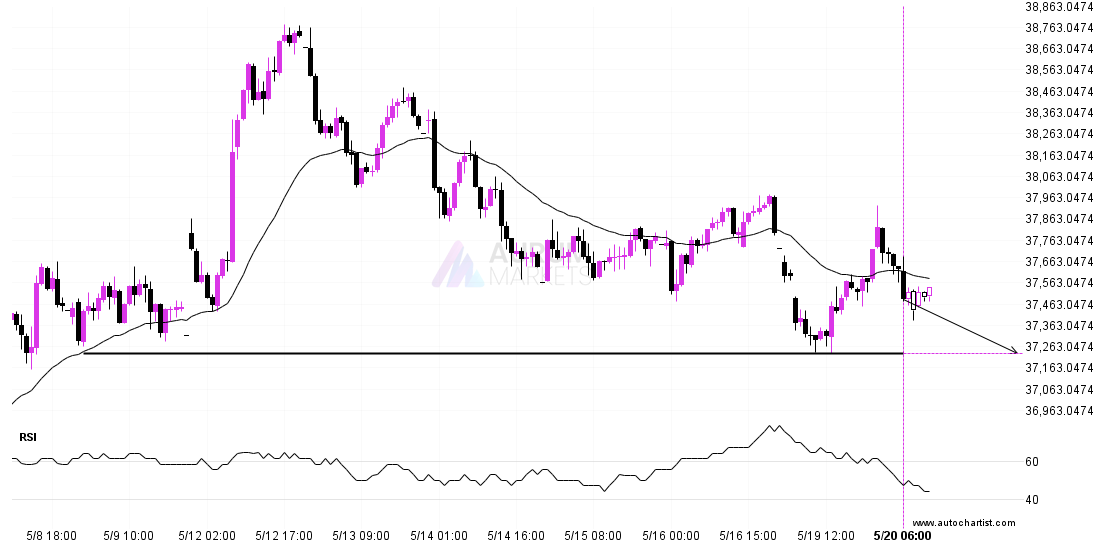
Nikkei 225 is heading towards a line of 37230.0000. If this movement continues, the price of Nikkei 225 could test 37230.0000 within the next 2 days. But don’t be so

Read MoreRead More

Posts pagination

Previous 1 … 31 32 33 … 55 Next

Recent Posts

  • 3 Point Extension Fibonacci pattern identified at 12/27 14:30. Possible bearish price movement towards target levels ranging from 454.50 to 311.16 within the next 10 days.
  • US30 Dow Jones Industrial Average Index is approaching an important level at 48456.12
  • A potential bearish move in FRA40 CAC 40 French Index
  • Trade outlook for EURAUD from 2025-12-22 05:00:00.000 until 2025-12-22 05:00:00.000
  • Gartley Fibonacci pattern identified at 12/19 14:30. This pattern is still in the process of forming. Possible bearish price movement towards target levels ranging from 238.54 to 203.78 within the next 12 days.

Recent Comments

No comments to show.
  • Technical Analysis

Search

Archives

  • December 2025
  • November 2025
  • October 2025
  • September 2025
  • August 2025
  • July 2025
  • June 2025
  • May 2025
  • April 2025
  • March 2025
  • February 2025
  • January 2025

Meta

  • Register
  • Log in

Categories

  • Technical Analysis

Educational Landing Page WordPress Theme Copyright @ 2025 Aurum Markets Limited

Back To Top