Skip to contentSkip to content
Aurum Markets Blog
  • Home
  • Technical Analysis
  • Market Insights
  • Client & IB Login
  • Register
Close Button

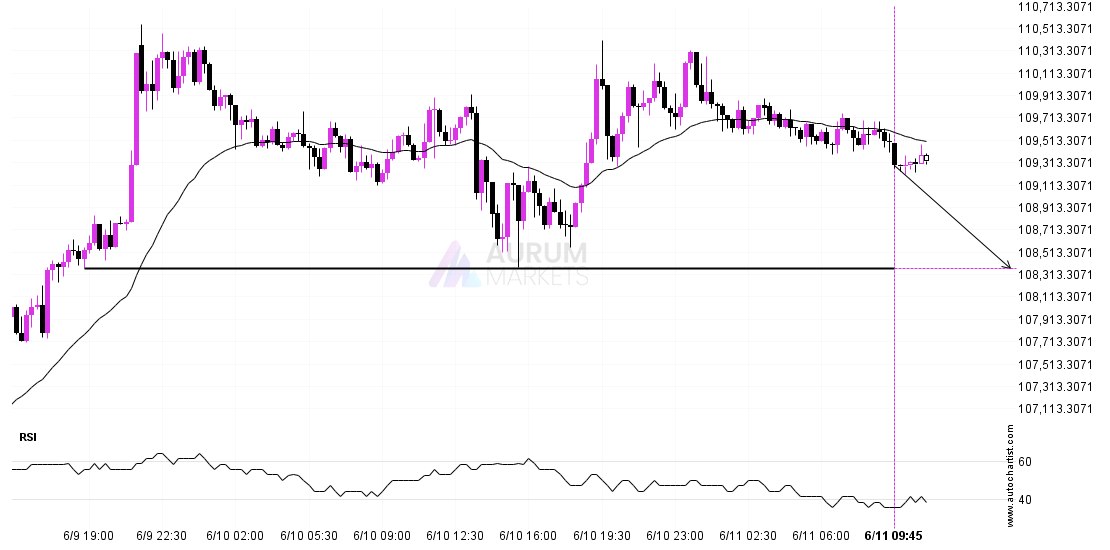
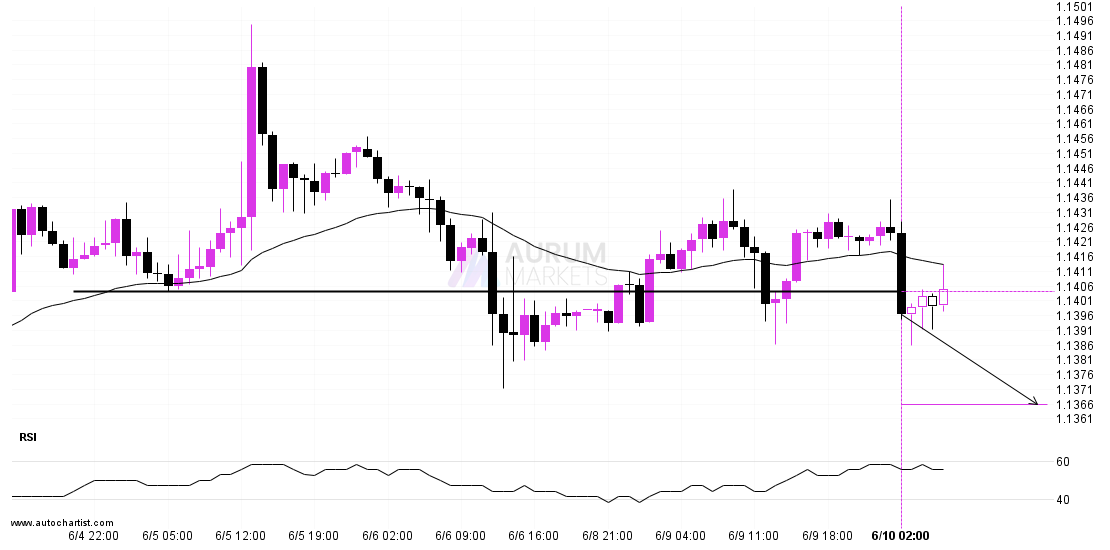
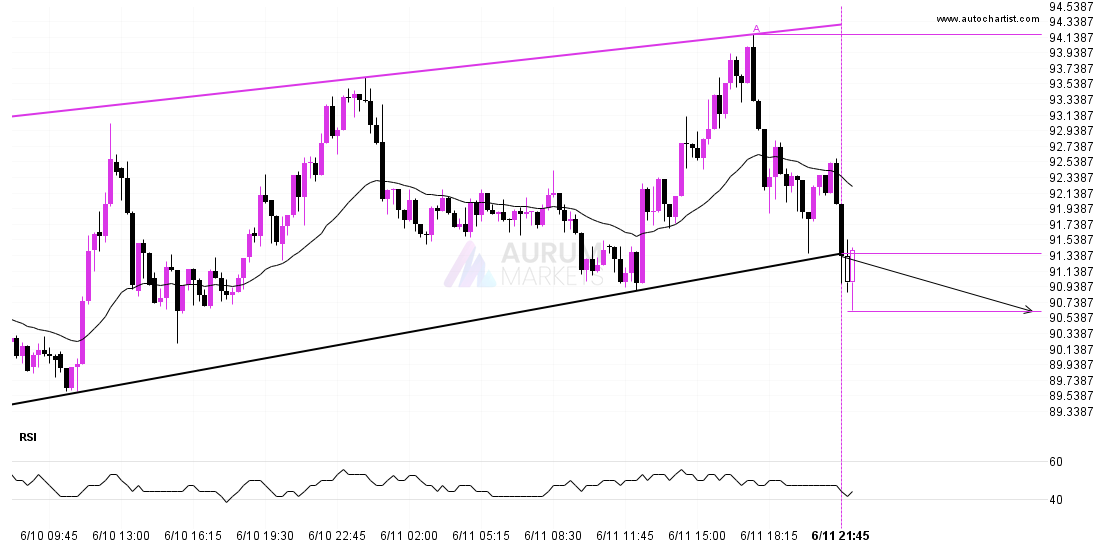
LTCUSD breakout through supportLTCUSD breakout through support

June 11, 2025June 11, 2025| admin-aurumadmin-aurum| 0 Comment| 10:17 pm

Channel Up pattern identified on LTCUSD has broken through a support level with the price momentum continuing to move in an downward direction. A solid trading opportunity continues with the

Read MoreRead More

BTCUSD approaching important bearish key levelBTCUSD approaching important bearish key level

June 11, 2025June 11, 2025| admin-aurumadmin-aurum| 0 Comment| 11:18 am

BTCUSD is moving towards a key support level at 108370.7500. BTCUSD has previously tested this level 3 times and on each occasion it has bounced back off this level. Is

Read MoreRead More

Should we expect a breakout or a rebound on ASX 225?Should we expect a breakout or a rebound on ASX 225?

June 11, 2025June 11, 2025| admin-aurumadmin-aurum| 0 Comment| 6:13 am

ASX 225 is trapped in a Channel Up formation, implying that a breakout is Imminent. This is a great trade-setup for both trend and swing traders. It is now approaching

Read MoreRead More

USDCHF – getting close to psychological price lineUSDCHF – getting close to psychological price line

June 10, 2025June 10, 2025| admin-aurumadmin-aurum| 0 Comment| 10:16 pm

USDCHF is heading towards 0.8250 and could reach this point within the next 2 days. It has tested this line numerous times in the past, and this time could be

Read MoreRead More

ETHUSD breakout through supportETHUSD breakout through support

June 10, 2025June 10, 2025| admin-aurumadmin-aurum| 0 Comment| 11:22 am

ETHUSD has broken through a support line of a Triangle chart pattern. If this breakout holds true, we may see the price of ETHUSD testing 2652.1249 within the next 6

Read MoreRead More

EURUSD – support line broken at 2025-06-10T03:00:00.000ZEURUSD – support line broken at 2025-06-10T03:00:00.000Z

June 10, 2025June 10, 2025| admin-aurumadmin-aurum| 0 Comment| 6:16 am

EURUSD has broken through a line of 1.1405. If this breakout holds true, we could see the price of EURUSD heading towards 1.1366 within the next 15 hours. But don’t

Read MoreRead More

A potential bearish movement on DAX 40A potential bearish movement on DAX 40

June 9, 2025June 9, 2025| admin-aurumadmin-aurum| 0 Comment| 10:17 pm

Emerging Falling Wedge detected on DAX 40 – the pattern is an emerging one and has not yet broken through resistance, but the price is expected to move up over

Read MoreRead More

Should we expect a breakout or a rebound on DAX 40?Should we expect a breakout or a rebound on DAX 40?

June 9, 2025June 9, 2025| admin-aurumadmin-aurum| 0 Comment| 11:17 am

A strong support level has been identified at 23999.6992 on the 30 Minutes DAX 40 chart. DAX 40 is likely to test it soon. Supported by Downward sloping Moving Average

Read MoreRead More

Should we expect a breakout or a rebound on AUDUSD?Should we expect a breakout or a rebound on AUDUSD?

June 9, 2025June 9, 2025| admin-aurumadmin-aurum| 0 Comment| 6:16 am

AUDUSD is approaching the resistance line of a Channel Up. It has touched this line numerous times in the last 10 days. If it tests this line again, it should

Read MoreRead More

Breach of important price line imminent by EURUSDBreach of important price line imminent by EURUSD

June 8, 2025June 8, 2025| admin-aurumadmin-aurum| 0 Comment| 10:16 pm

EURUSD is moving towards a line of 1.1296 which it has tested numerous times in the past. We have seen it retrace from this position in the past, so at

Read MoreRead More

Posts pagination

Previous 1 … 27 28 29 … 55 Next

Recent Posts

  • 3 Point Extension Fibonacci pattern identified at 12/27 14:30. Possible bearish price movement towards target levels ranging from 454.50 to 311.16 within the next 10 days.
  • US30 Dow Jones Industrial Average Index is approaching an important level at 48456.12
  • A potential bearish move in FRA40 CAC 40 French Index
  • Trade outlook for EURAUD from 2025-12-22 05:00:00.000 until 2025-12-22 05:00:00.000
  • Gartley Fibonacci pattern identified at 12/19 14:30. This pattern is still in the process of forming. Possible bearish price movement towards target levels ranging from 238.54 to 203.78 within the next 12 days.

Recent Comments

No comments to show.
  • Technical Analysis

Search

Archives

  • December 2025
  • November 2025
  • October 2025
  • September 2025
  • August 2025
  • July 2025
  • June 2025
  • May 2025
  • April 2025
  • March 2025
  • February 2025
  • January 2025

Meta

  • Register
  • Log in

Categories

  • Technical Analysis

Educational Landing Page WordPress Theme Copyright @ 2025 Aurum Markets Limited

Back To Top