Skip to contentSkip to content
Aurum Markets Blog
  • Home
  • Technical Analysis
  • Market Insights
  • Client & IB Login
  • Register
Close Button

LTCUSD – getting close to resistance of a Channel DownLTCUSD – getting close to resistance of a Channel Down

June 22, 2025June 22, 2025| admin-aurumadmin-aurum| 0 Comment| 10:14 pm

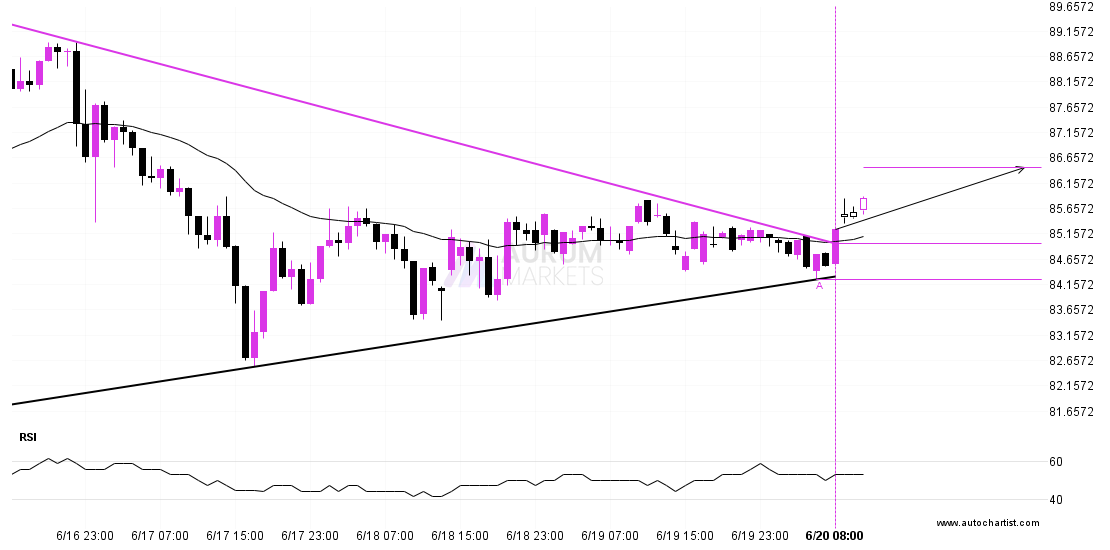
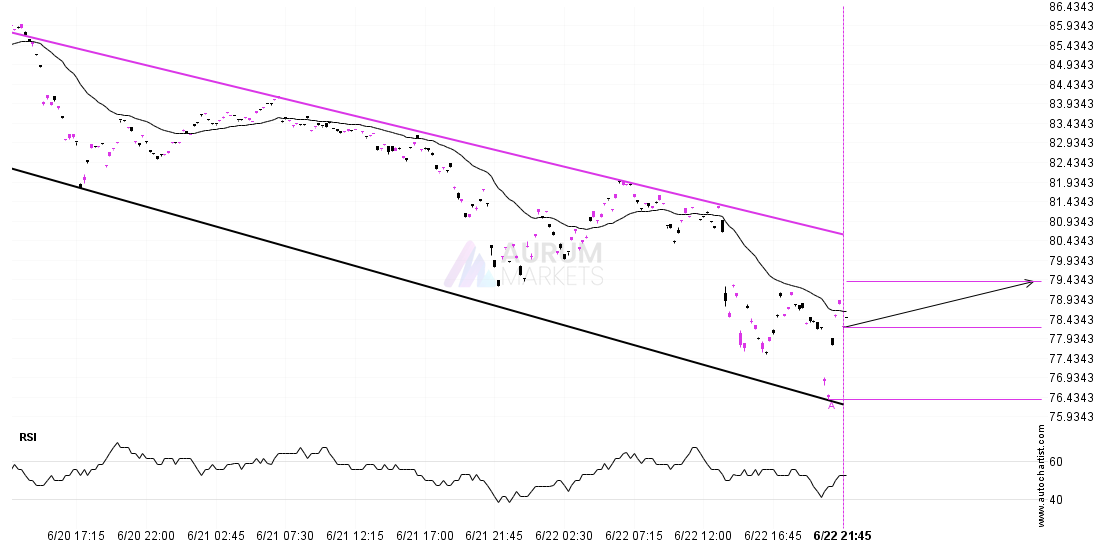
LTCUSD is heading towards the resistance line of a Channel Down. If this movement continues, the price of LTCUSD could test 79.4002 within the next 17 hours. It has tested

Read MoreRead More

Continuation pattern on LTCUSDContinuation pattern on LTCUSD

June 20, 2025June 20, 2025| admin-aurumadmin-aurum| 0 Comment| 3:53 pm

The breakout of LTCUSD through the resistance line of a Triangle could be a sign of the road ahead. If this breakout persists, we may see the price of LTCUSD

Read MoreRead More

ETHUSD approaching resistance levelETHUSD approaching resistance level

June 20, 2025June 20, 2025| admin-aurumadmin-aurum| 0 Comment| 6:14 am

ETHUSD is heading towards a line of 2521.3000. If this movement continues, the price of ETHUSD could test 2521.3000 within the next 10 hours. But don’t be so quick to

Read MoreRead More

A potential bullish movement on ASX 225A potential bullish movement on ASX 225

June 19, 2025June 19, 2025| admin-aurumadmin-aurum| 0 Comment| 10:16 pm

Emerging Channel Down pattern in its final wave was identified on the ASX 225 1 hour chart. After a strong bullish run, we find ASX 225 heading towards the upper

Read MoreRead More

Will AUDUSD have enough momentum to break support?Will AUDUSD have enough momentum to break support?

June 19, 2025June 19, 2025| admin-aurumadmin-aurum| 0 Comment| 11:51 am

AUDUSD is heading towards the support line of a Falling Wedge and could reach this point within the next 6 hours. It has tested this line numerous times in the

Read MoreRead More

Either a rebound or a breakout imminent on LTCUSDEither a rebound or a breakout imminent on LTCUSD

June 19, 2025June 19, 2025| admin-aurumadmin-aurum| 0 Comment| 6:16 am

LTCUSD is about to retest a key horizontal resistance level near 85.6600. It has tested this level 5 times in the recent past and could simply bounce off like it

Read MoreRead More

Possibility of big movement expected on DOW 30Possibility of big movement expected on DOW 30

June 18, 2025June 18, 2025| admin-aurumadmin-aurum| 0 Comment| 10:22 pm

DOW 30 has broken through the support line which it has tested twice in the past. We have seen it retrace from this line before, so one should wait for

Read MoreRead More

Confirmed breakout on GBPUSD 4 hour chartConfirmed breakout on GBPUSD 4 hour chart

June 18, 2025June 18, 2025| admin-aurumadmin-aurum| 0 Comment| 11:17 am

GBPUSD has breached the support line at 1.3516. It may continue the bearish trend towards 1.3376, or, it may prove to be yet another test of this level. Supported by

Read MoreRead More

FTSE 100 – Continuation Chart Pattern – Falling WedgeFTSE 100 – Continuation Chart Pattern – Falling Wedge

June 18, 2025June 18, 2025| admin-aurumadmin-aurum| 0 Comment| 6:47 am

FTSE 100 is heading towards the support line of a Falling Wedge and could reach this point within the next 5 hours. It has tested this line numerous times in

Read MoreRead More

Should we expect a breakout or a rebound on Nikkei 225?Should we expect a breakout or a rebound on Nikkei 225?

June 17, 2025June 17, 2025| admin-aurumadmin-aurum| 0 Comment| 11:15 am

Nikkei 225 is moving towards a key support level at 38093.0000. This is a previously tested level for Nikkei 225. This could be a good trading opportunity, either at the

Read MoreRead More

Posts pagination

Previous 1 … 25 26 27 … 55 Next

Recent Posts

  • 3 Point Extension Fibonacci pattern identified at 12/27 14:30. Possible bearish price movement towards target levels ranging from 454.50 to 311.16 within the next 10 days.
  • US30 Dow Jones Industrial Average Index is approaching an important level at 48456.12
  • A potential bearish move in FRA40 CAC 40 French Index
  • Trade outlook for EURAUD from 2025-12-22 05:00:00.000 until 2025-12-22 05:00:00.000
  • Gartley Fibonacci pattern identified at 12/19 14:30. This pattern is still in the process of forming. Possible bearish price movement towards target levels ranging from 238.54 to 203.78 within the next 12 days.

Recent Comments

No comments to show.
  • Technical Analysis

Search

Archives

  • December 2025
  • November 2025
  • October 2025
  • September 2025
  • August 2025
  • July 2025
  • June 2025
  • May 2025
  • April 2025
  • March 2025
  • February 2025
  • January 2025

Meta

  • Register
  • Log in

Categories

  • Technical Analysis

Educational Landing Page WordPress Theme Copyright @ 2025 Aurum Markets Limited

Back To Top