Skip to contentSkip to content
Aurum Markets Blog
  • Home
  • Technical Analysis
  • Market Insights
  • Client & IB Login
  • Register
Close Button

DOW 30 breakout through resistanceDOW 30 breakout through resistance

June 26, 2025June 26, 2025| admin-aurumadmin-aurum| 0 Comment| 6:15 am

DOW 30 has broken through a resistance line. Because we have seen it retrace from this price in the past, one should wait for confirmation of the breakout before trading.

Read MoreRead More

Either a rebound or a breakout imminent on FTSE 100Either a rebound or a breakout imminent on FTSE 100

June 25, 2025June 25, 2025| admin-aurumadmin-aurum| 0 Comment| 10:15 pm

An emerging Channel Down has been detected on FTSE 100 on the 1 hour chart. There is a possible move towards 8659.6319 next few candles. Once reaching resistance it may

Read MoreRead More

Either a rebound or a breakout imminent on ASX 225Either a rebound or a breakout imminent on ASX 225

June 25, 2025June 25, 2025| admin-aurumadmin-aurum| 0 Comment| 11:18 am

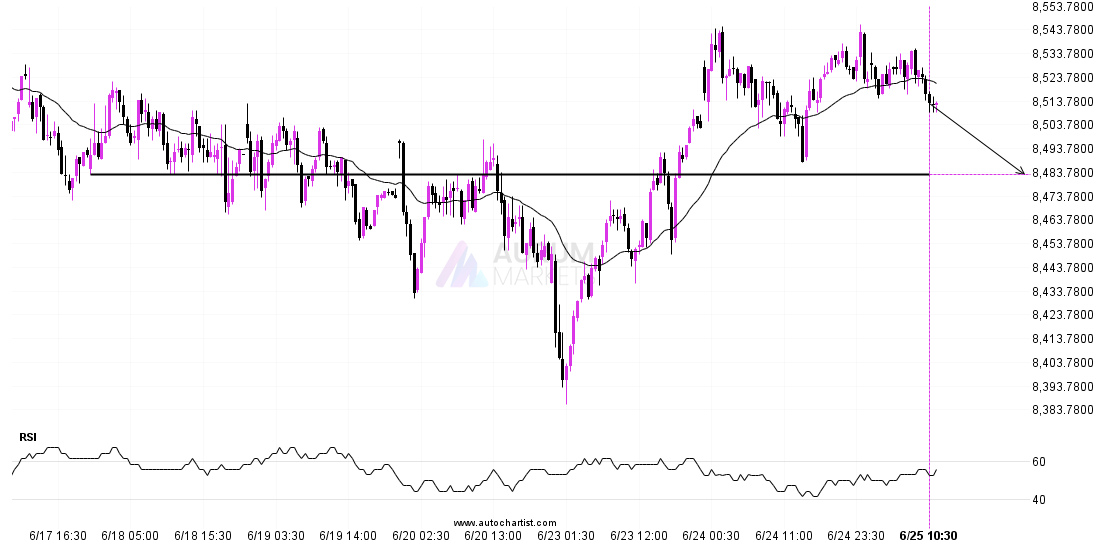
ASX 225 is heading towards 8482.9004 and could reach this point within the next 2 days. It has tested this line numerous times in the past, and this time could

Read MoreRead More

Confirmed breakout on ETHUSD 1 hour chartConfirmed breakout on ETHUSD 1 hour chart

June 25, 2025June 25, 2025| admin-aurumadmin-aurum| 0 Comment| 6:13 am

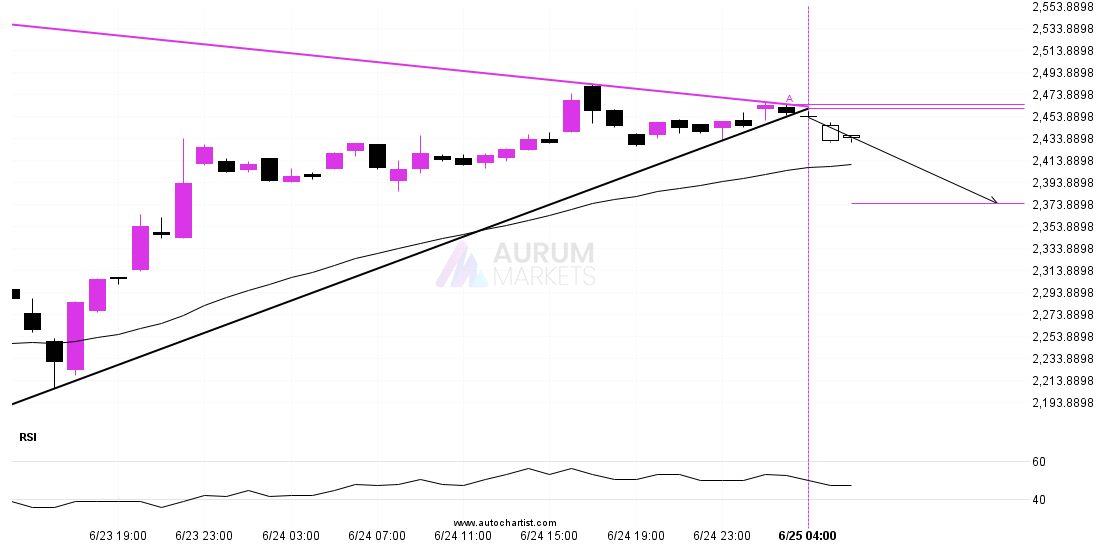
ETHUSD has broken through a support line of a Triangle and suggests a possible movement to 2374.4161 within the next 8 hours. It has tested this line in the past,

Read MoreRead More

Should we expect a breakout or a rebound on ASX 225?Should we expect a breakout or a rebound on ASX 225?

June 24, 2025June 24, 2025| admin-aurumadmin-aurum| 0 Comment| 10:16 pm

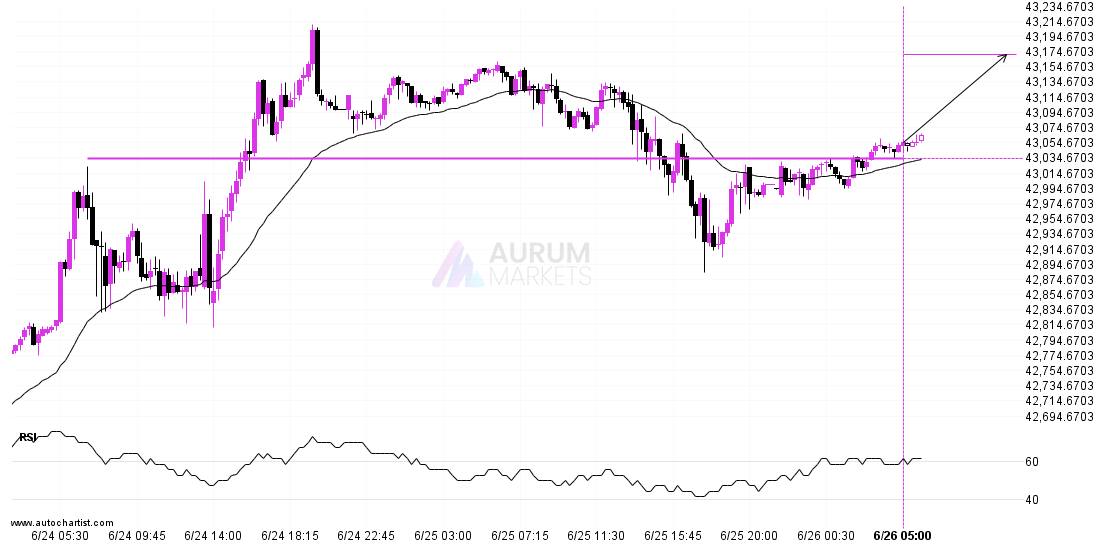
ASX 225 is moving towards a line of 8547.2002 which it has tested numerous times in the past. We have seen it retrace from this position in the past, so

Read MoreRead More

Nikkei 225 approaching resistance of a Rising WedgeNikkei 225 approaching resistance of a Rising Wedge

June 24, 2025June 24, 2025| admin-aurumadmin-aurum| 0 Comment| 11:14 am

Nikkei 225 is trapped in a Rising Wedge formation, implying that a breakout is Imminent. This is a great trade-setup for both trend and swing traders. It is now approaching

Read MoreRead More

BTCUSD breakout through resistanceBTCUSD breakout through resistance

June 24, 2025June 24, 2025| admin-aurumadmin-aurum| 0 Comment| 6:16 am

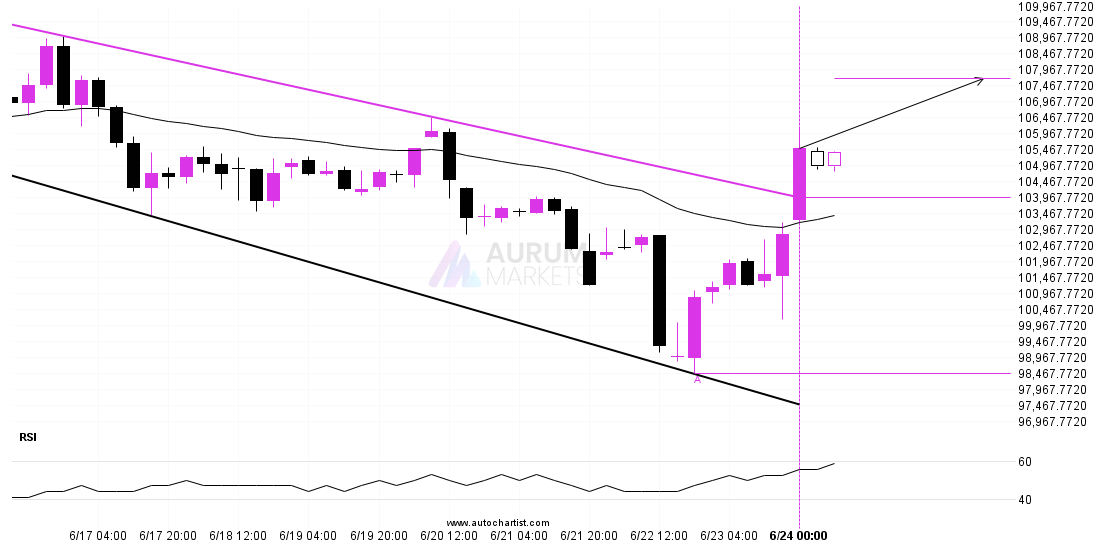
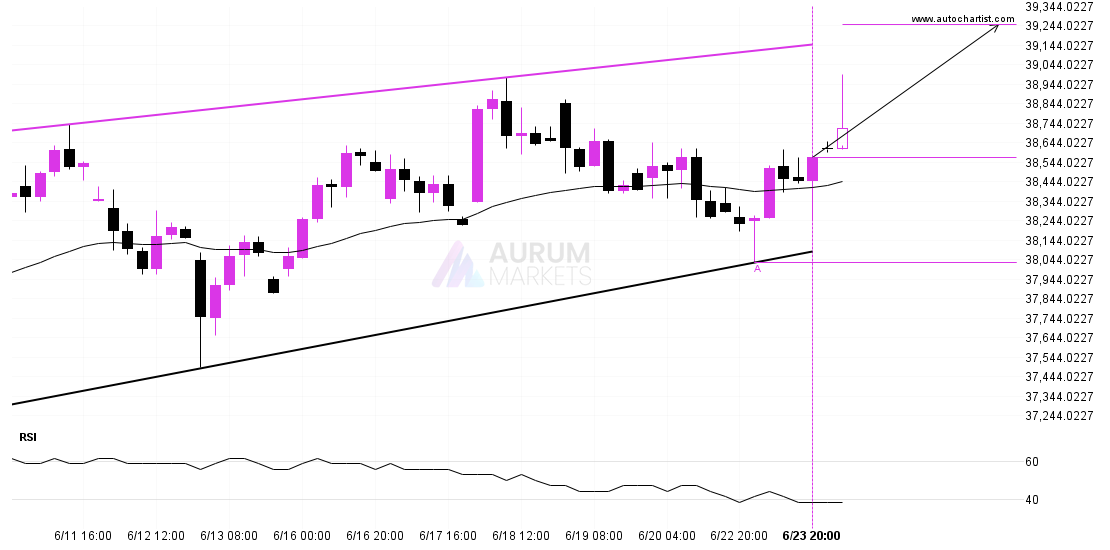
BTCUSD has broken through a resistance line. It has touched this line at least twice in the last 12 days. This breakout may indicate a potential move to 107713.2473 within

Read MoreRead More

USDJPY approaching important level of 144.3275USDJPY approaching important level of 144.3275

June 23, 2025June 23, 2025| admin-aurumadmin-aurum| 0 Comment| 10:20 pm

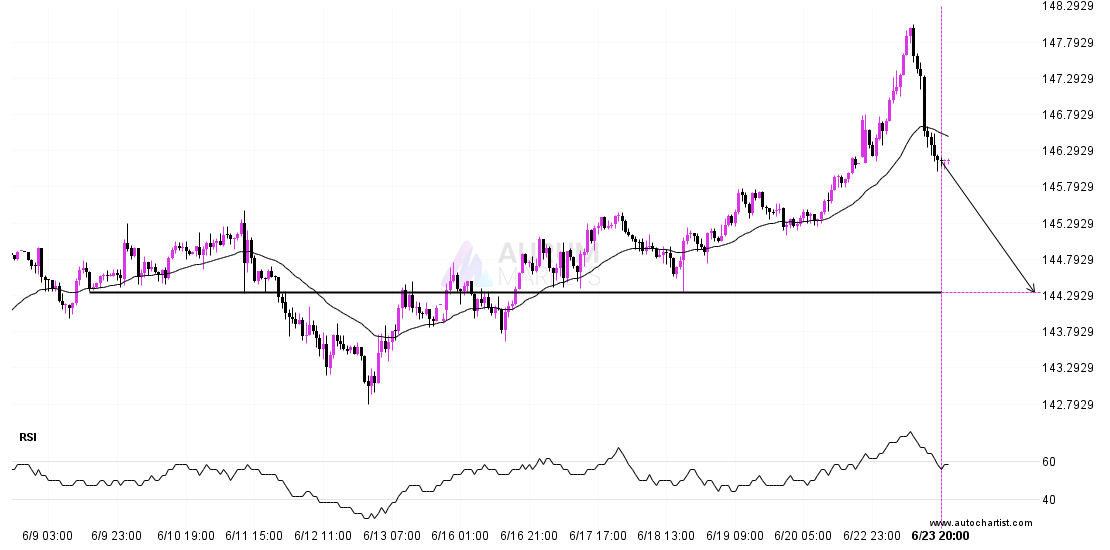
USDJPY is en route to a very important line that will be a definite deciding factor of what is to come! We may see this trajectory continue to touch and

Read MoreRead More

USDCAD – getting close to resistance of a Channel UpUSDCAD – getting close to resistance of a Channel Up

June 23, 2025June 23, 2025| admin-aurumadmin-aurum| 0 Comment| 11:15 am

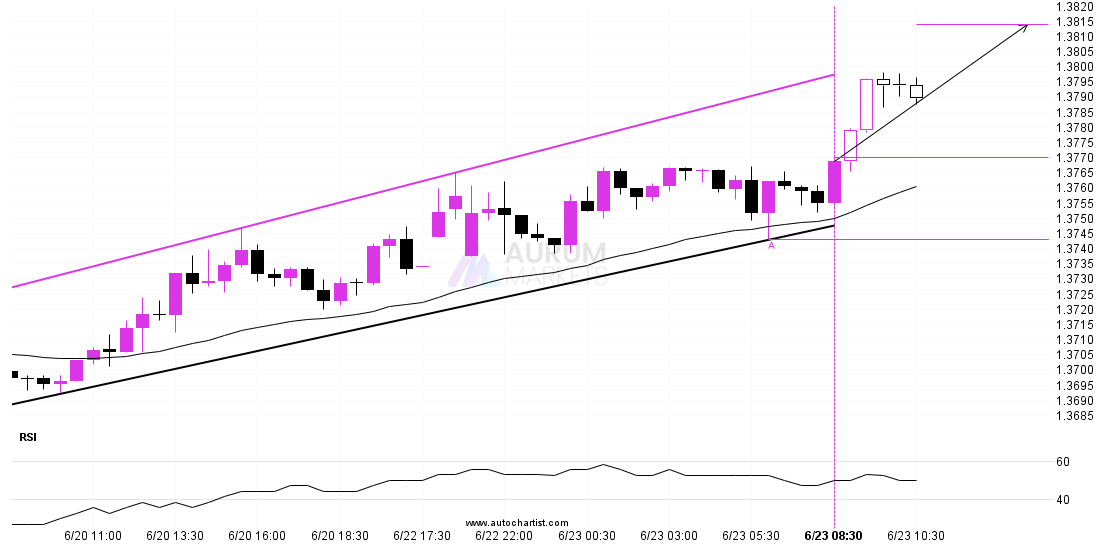
Emerging Channel Up detected on USDCAD – the pattern is an emerging one and has not yet broken through support, but the price is expected to move up over the

Read MoreRead More

ASX 225 approaching important bullish key levelASX 225 approaching important bullish key level

June 23, 2025June 23, 2025| admin-aurumadmin-aurum| 0 Comment| 6:15 am

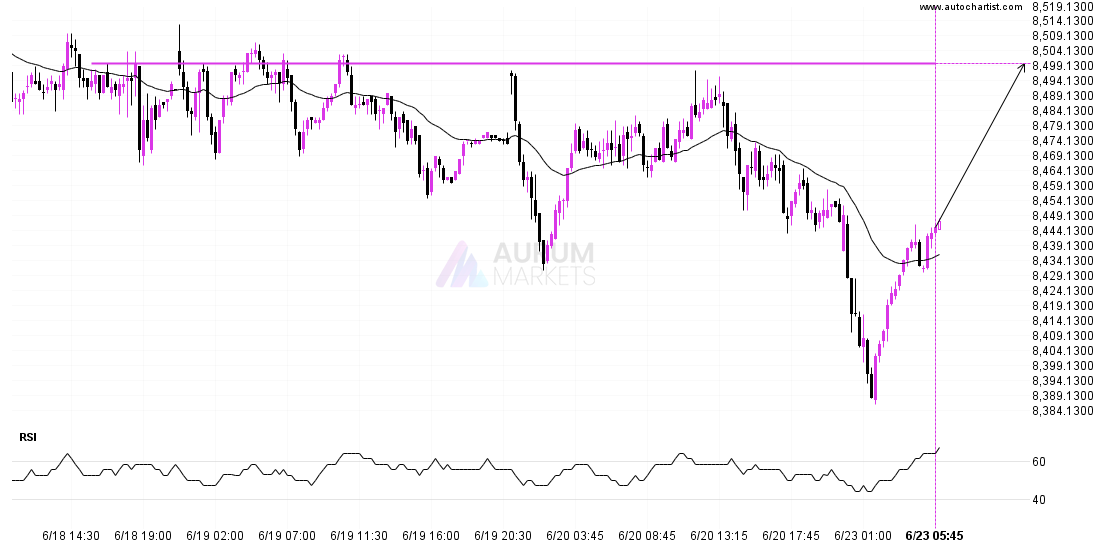
ASX 225 is moving towards a resistance line. Because we have seen it retrace from this level in the past, we could see either a break through this line, or

Read MoreRead More

Posts pagination

Previous 1 … 24 25 26 … 55 Next

Recent Posts

  • 3 Point Extension Fibonacci pattern identified at 12/27 14:30. Possible bearish price movement towards target levels ranging from 454.50 to 311.16 within the next 10 days.
  • US30 Dow Jones Industrial Average Index is approaching an important level at 48456.12
  • A potential bearish move in FRA40 CAC 40 French Index
  • Trade outlook for EURAUD from 2025-12-22 05:00:00.000 until 2025-12-22 05:00:00.000
  • Gartley Fibonacci pattern identified at 12/19 14:30. This pattern is still in the process of forming. Possible bearish price movement towards target levels ranging from 238.54 to 203.78 within the next 12 days.

Recent Comments

No comments to show.
  • Technical Analysis

Search

Archives

  • December 2025
  • November 2025
  • October 2025
  • September 2025
  • August 2025
  • July 2025
  • June 2025
  • May 2025
  • April 2025
  • March 2025
  • February 2025
  • January 2025

Meta

  • Register
  • Log in

Categories

  • Technical Analysis

Educational Landing Page WordPress Theme Copyright @ 2025 Aurum Markets Limited

Back To Top