Skip to contentSkip to content
Aurum Markets Blog
  • Home
  • Technical Analysis
  • Market Insights
  • Client & IB Login
  • Register
Close Button

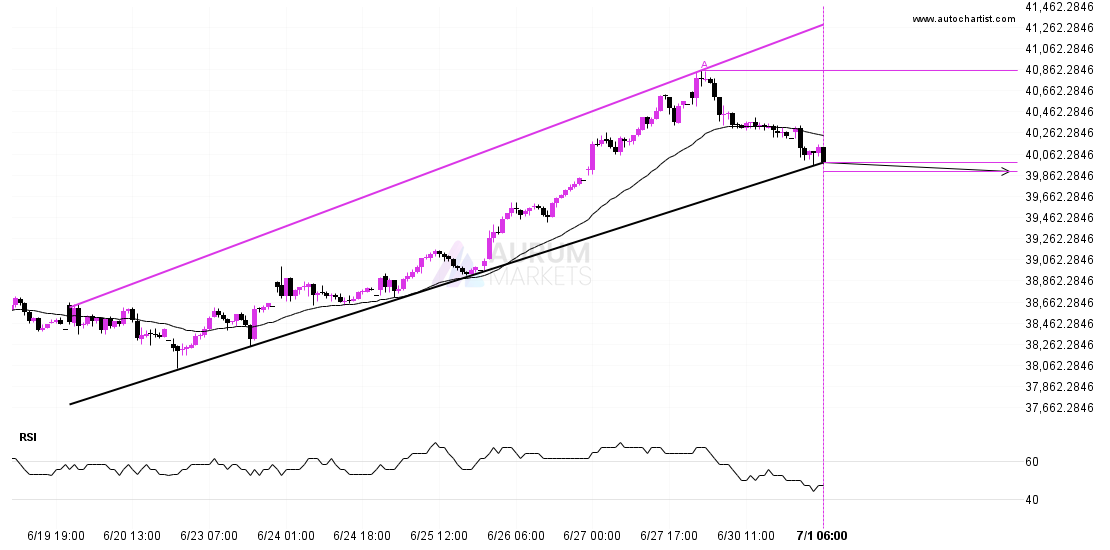
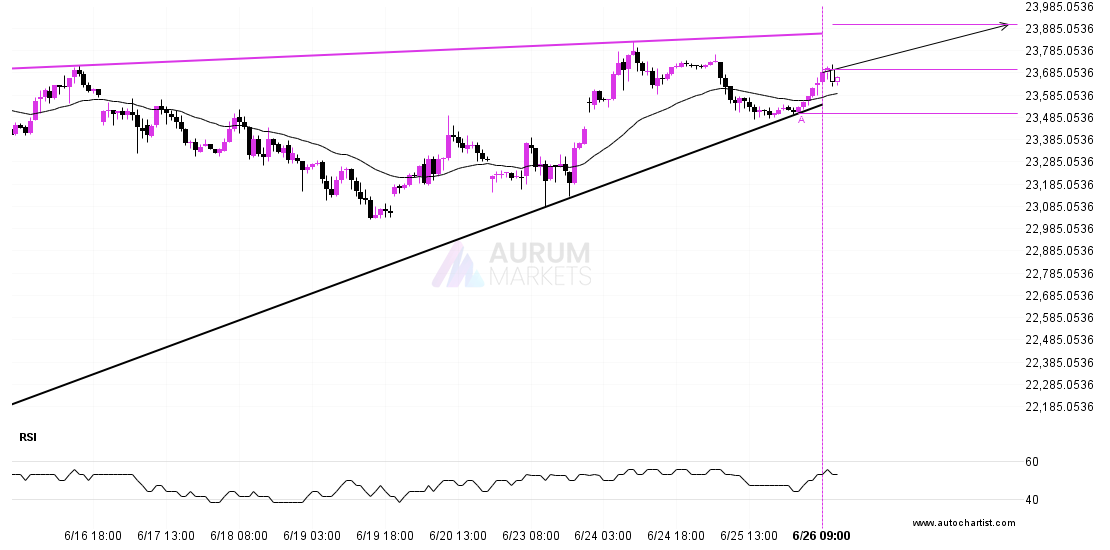
Either a rebound or a breakout imminent on BTCUSDEither a rebound or a breakout imminent on BTCUSD

July 1, 2025July 1, 2025| admin-aurumadmin-aurum| 0 Comment| 11:14 am

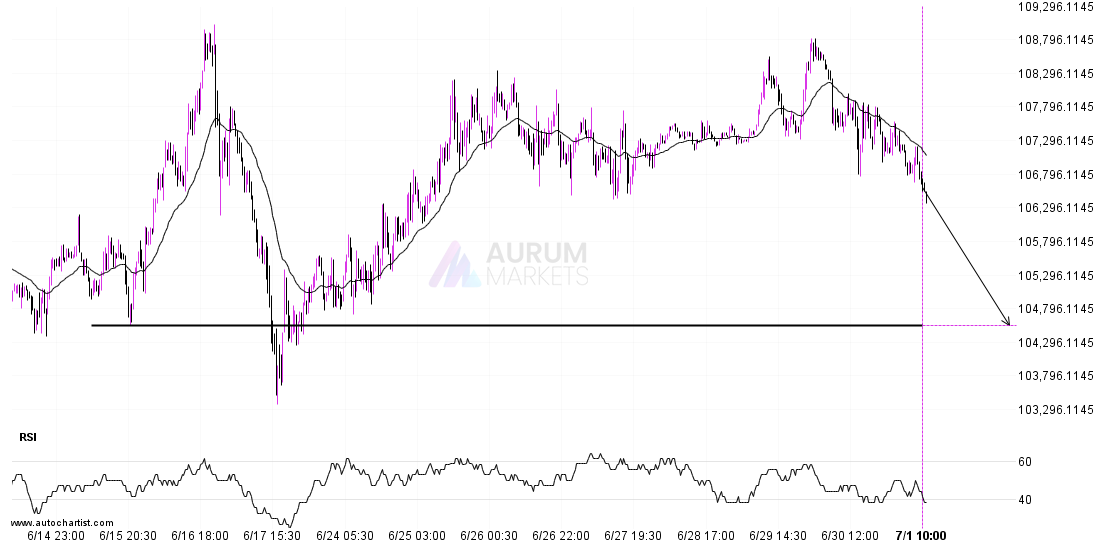
BTCUSD is heading towards 104546.1094 and could reach this point within the next 3 days. It has tested this line numerous times in the past, and this time could be

Read MoreRead More

Nikkei 225 breakout through supportNikkei 225 breakout through support

July 1, 2025July 1, 2025| admin-aurumadmin-aurum| 0 Comment| 6:16 am

The last 12 1 hour candles on Nikkei 225 formed a Channel Up pattern and broken out through the pattern lines, indicating a possible bearish movement towards the price level

Read MoreRead More

DOW 30 approaching resistance of a Channel UpDOW 30 approaching resistance of a Channel Up

June 30, 2025June 30, 2025| admin-aurumadmin-aurum| 0 Comment| 10:17 pm

DOW 30 is moving towards a resistance line which it has tested numerous times in the past. We have seen it retrace from this line before, so at this stage

Read MoreRead More

ETHUSD short term bearish trade setup to 2409.5100ETHUSD short term bearish trade setup to 2409.5100

June 30, 2025June 30, 2025| admin-aurumadmin-aurum| 0 Comment| 11:16 am

ETHUSD is moving towards a key support level at 2409.5100. This is a previously tested level for ETHUSD. This could be a good trading opportunity, either at the spot price,

Read MoreRead More

Confirmed breakout on BTCUSD 1 hour chartConfirmed breakout on BTCUSD 1 hour chart

June 30, 2025June 30, 2025| admin-aurumadmin-aurum| 0 Comment| 6:15 am

BTCUSD has broken through a resistance line of a Triangle and suggests a possible movement to 109751.8429 within the next 3 days. It has tested this line in the past,

Read MoreRead More

Should we expect a breakout or a rebound on ASX 225?Should we expect a breakout or a rebound on ASX 225?

June 29, 2025June 29, 2025| admin-aurumadmin-aurum| 0 Comment| 10:21 pm

The movement of ASX 225 towards 8480.0000 price line is yet another test of the line it reached numerous times in the past. We could expect this test to happen

Read MoreRead More

Breach of important price line imminent by FTSE 100Breach of important price line imminent by FTSE 100

June 27, 2025June 27, 2025| admin-aurumadmin-aurum| 0 Comment| 11:16 am

FTSE 100 is moving towards a resistance line. Because we have seen it retrace from this level in the past, we could see either a break through this line, or

Read MoreRead More

Should we expect a breakout or a rebound on DAX 40?Should we expect a breakout or a rebound on DAX 40?

June 27, 2025June 27, 2025| admin-aurumadmin-aurum| 0 Comment| 6:20 am

DAX 40 is approaching the resistance line of a Rising Wedge. It has touched this line numerous times in the last 14 days. If it tests this line again, it

Read MoreRead More

Breach of important price line imminent by LTCUSDBreach of important price line imminent by LTCUSD

June 26, 2025June 26, 2025| admin-aurumadmin-aurum| 0 Comment| 10:15 pm

LTCUSD is heading towards a line of 83.7500. If this movement continues, the price of LTCUSD could test 83.7500 within the next 19 hours. But don’t be so quick to

Read MoreRead More

Should we expect a breakout or a rebound on DAX 40?Should we expect a breakout or a rebound on DAX 40?

June 26, 2025June 26, 2025| admin-aurumadmin-aurum| 0 Comment| 11:16 am

DAX 40 is heading towards the resistance line of a Rising Wedge and could reach this point within the next 2 days. It has tested this line numerous times in

Read MoreRead More

Posts pagination

Previous 1 … 23 24 25 … 55 Next

Recent Posts

  • 3 Point Extension Fibonacci pattern identified at 12/27 14:30. Possible bearish price movement towards target levels ranging from 454.50 to 311.16 within the next 10 days.
  • US30 Dow Jones Industrial Average Index is approaching an important level at 48456.12
  • A potential bearish move in FRA40 CAC 40 French Index
  • Trade outlook for EURAUD from 2025-12-22 05:00:00.000 until 2025-12-22 05:00:00.000
  • Gartley Fibonacci pattern identified at 12/19 14:30. This pattern is still in the process of forming. Possible bearish price movement towards target levels ranging from 238.54 to 203.78 within the next 12 days.

Recent Comments

No comments to show.
  • Technical Analysis

Search

Archives

  • December 2025
  • November 2025
  • October 2025
  • September 2025
  • August 2025
  • July 2025
  • June 2025
  • May 2025
  • April 2025
  • March 2025
  • February 2025
  • January 2025

Meta

  • Register
  • Log in

Categories

  • Technical Analysis

Educational Landing Page WordPress Theme Copyright @ 2025 Aurum Markets Limited

Back To Top