Skip to contentSkip to content
Aurum Markets Blog
  • Home
  • Technical Analysis
  • Market Insights
  • Client & IB Login
  • Register
Close Button

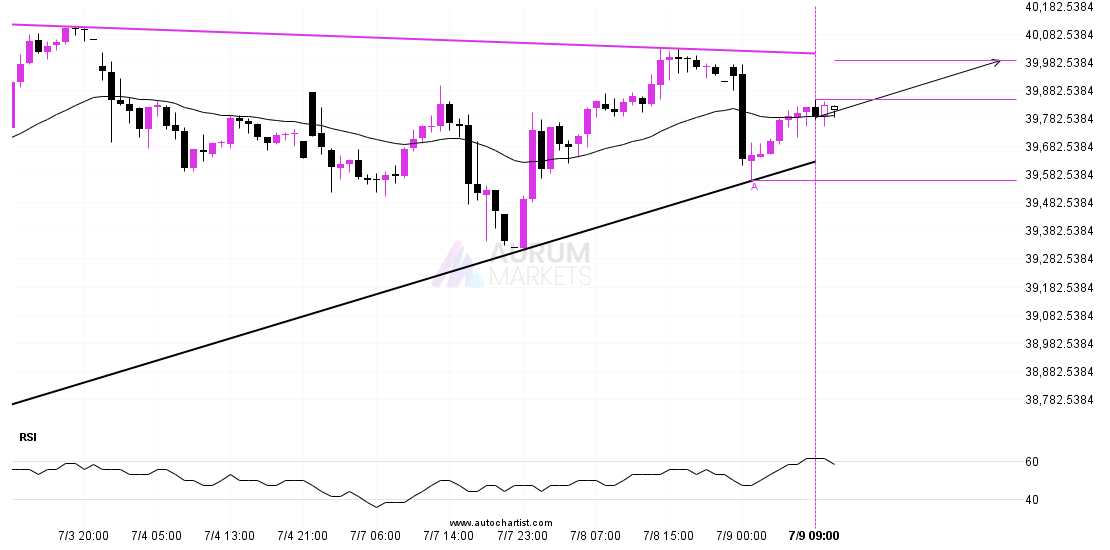
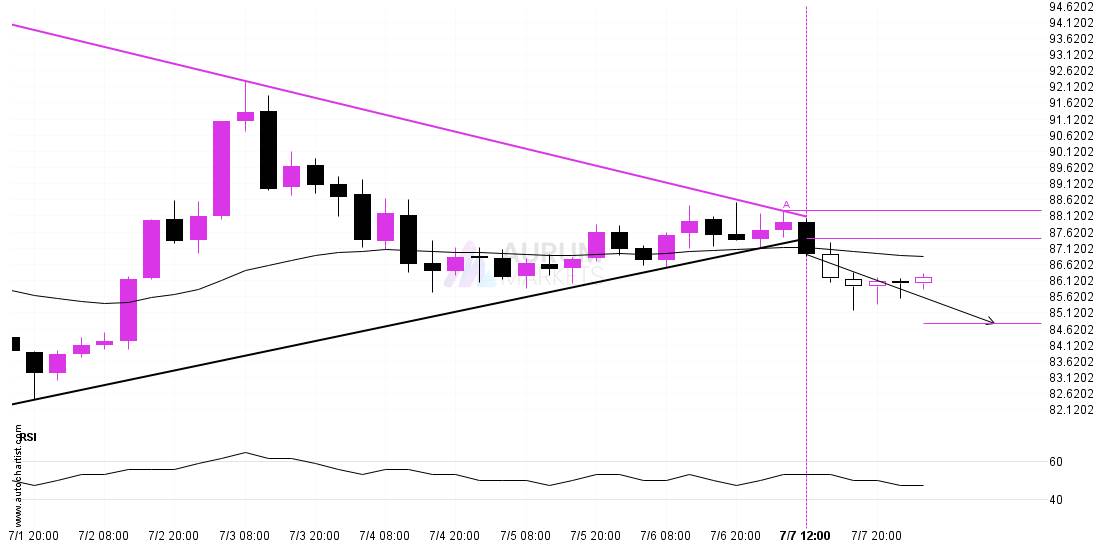
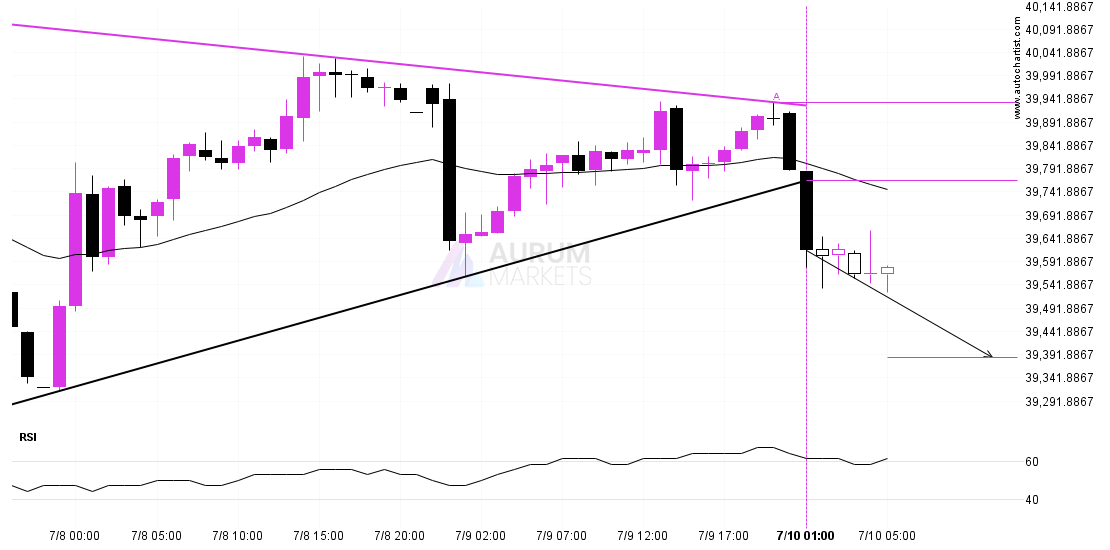
Should we expect a bearish trend on Nikkei 225?Should we expect a bearish trend on Nikkei 225?

July 10, 2025July 10, 2025| admin-aurumadmin-aurum| 0 Comment| 6:15 am

Triangle pattern identified on Nikkei 225 has broken through a support level with the price momentum continuing to move in an downward direction. A solid trading opportunity continues with the

Read MoreRead More

Important price line breached by LTCUSDImportant price line breached by LTCUSD

July 9, 2025July 9, 2025| admin-aurumadmin-aurum| 0 Comment| 10:17 pm

LTCUSD has broken through a line of 89.0000. If this breakout holds true, we could see the price of LTCUSD heading towards 92.4660 within the next 3 days. But don’t

Read MoreRead More

A potential bullish movement on Nikkei 225A potential bullish movement on Nikkei 225

July 9, 2025July 9, 2025| admin-aurumadmin-aurum| 0 Comment| 11:16 am

Nikkei 225 is approaching the resistance line of a Triangle. It has touched this line numerous times in the last 7 days. If it tests this line again, it should

Read MoreRead More

NZDUSD approaches important level of 0.6017NZDUSD approaches important level of 0.6017

July 9, 2025July 9, 2025| admin-aurumadmin-aurum| 0 Comment| 6:14 am

NZDUSD is about to retest a key horizontal resistance level near 0.6017. It has tested this level 5 times in the recent past and could simply bounce off like it

Read MoreRead More

BTCUSD – resistance line broken at 2025-07-08T20:00:00.000ZBTCUSD – resistance line broken at 2025-07-08T20:00:00.000Z

July 8, 2025July 8, 2025| admin-aurumadmin-aurum| 0 Comment| 10:15 pm

BTCUSD has broken through the resistance line which it has tested twice in the past. We have seen it retrace from this line before, so one should wait for confirmation

Read MoreRead More

Possible start of a bullish trend as DAX 40 breaks resistancePossible start of a bullish trend as DAX 40 breaks resistance

July 8, 2025July 8, 2025| admin-aurumadmin-aurum| 0 Comment| 11:16 am

DAX 40 has breached the resistance line at 24129.0000. It may continue the bullish trend towards 24332.3809, or, it may prove to be yet another test of this level. Supported

Read MoreRead More

LTCUSD – support line breachedLTCUSD – support line breached

July 8, 2025July 8, 2025| admin-aurumadmin-aurum| 0 Comment| 6:15 am

Triangle pattern identified on LTCUSD has broken through a support level with the price momentum continuing to move in an downward direction. A solid trading opportunity continues with the price

Read MoreRead More

DOW 30 broke through important 44490.4492 price lineDOW 30 broke through important 44490.4492 price line

July 7, 2025July 7, 2025| admin-aurumadmin-aurum| 0 Comment| 10:16 pm

DOW 30 has broken through a support line. It has touched this line numerous times in the last 6 days. This breakout shows a potential move to 44182.3750 within the

Read MoreRead More

A potential bullish movement on FTSE 100A potential bullish movement on FTSE 100

July 7, 2025July 7, 2025| admin-aurumadmin-aurum| 0 Comment| 11:16 am

FTSE 100 is approaching the resistance line of a Rising Wedge. It has touched this line numerous times in the last 12 days. If it tests this line again, it

Read MoreRead More

Either a rebound or a breakout imminent on DAX 40Either a rebound or a breakout imminent on DAX 40

July 7, 2025July 7, 2025| admin-aurumadmin-aurum| 0 Comment| 6:15 am

A strong support level has been identified at 23613.5000 on the 4 hour DAX 40 chart. DAX 40 is likely to test it soon. Target: 23613.5 Entry: 23768.4 Stop: 23834.714

Read MoreRead More

Posts pagination

Previous 1 … 21 22 23 … 55 Next

Recent Posts

  • 3 Point Extension Fibonacci pattern identified at 12/27 14:30. Possible bearish price movement towards target levels ranging from 454.50 to 311.16 within the next 10 days.
  • US30 Dow Jones Industrial Average Index is approaching an important level at 48456.12
  • A potential bearish move in FRA40 CAC 40 French Index
  • Trade outlook for EURAUD from 2025-12-22 05:00:00.000 until 2025-12-22 05:00:00.000
  • Gartley Fibonacci pattern identified at 12/19 14:30. This pattern is still in the process of forming. Possible bearish price movement towards target levels ranging from 238.54 to 203.78 within the next 12 days.

Recent Comments

No comments to show.
  • Technical Analysis

Search

Archives

  • December 2025
  • November 2025
  • October 2025
  • September 2025
  • August 2025
  • July 2025
  • June 2025
  • May 2025
  • April 2025
  • March 2025
  • February 2025
  • January 2025

Meta

  • Register
  • Log in

Categories

  • Technical Analysis

Educational Landing Page WordPress Theme Copyright @ 2025 Aurum Markets Limited

Back To Top