Skip to contentSkip to content
Aurum Markets Blog
  • Home
  • Technical Analysis
  • Market Insights
  • Client & IB Login
  • Register
Close Button

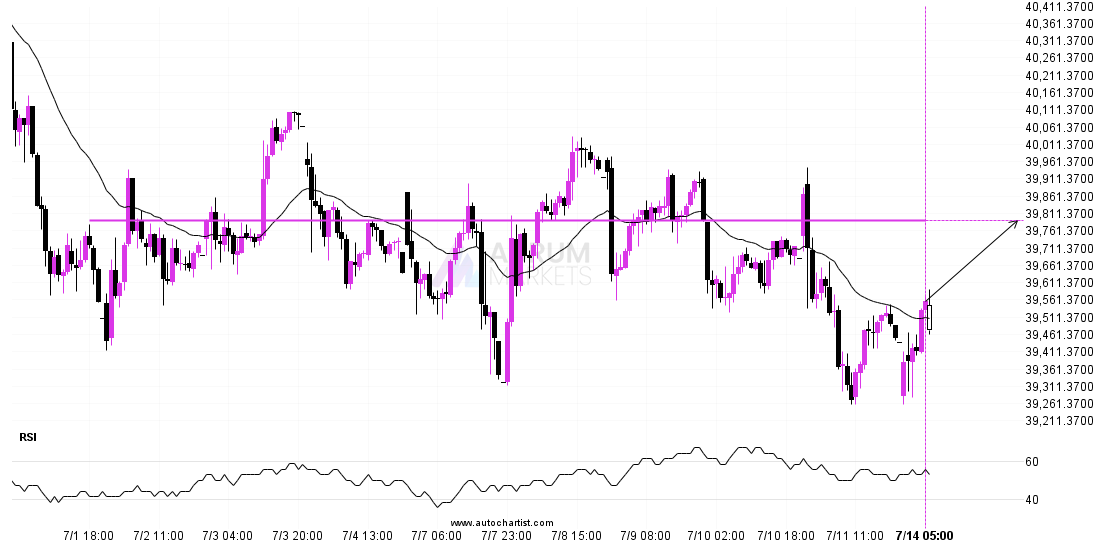
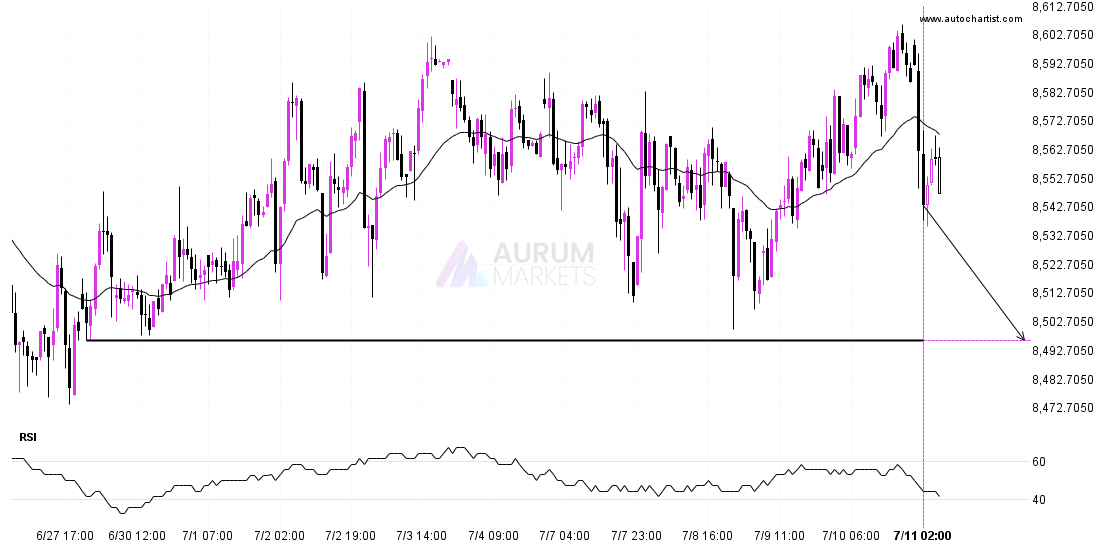
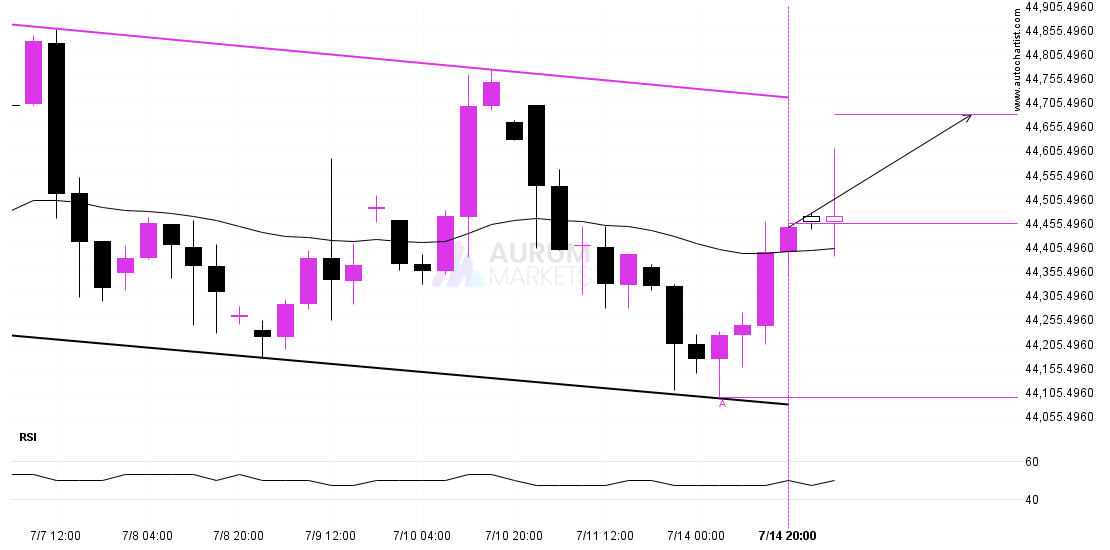
Should we expect a breakout or a rebound on DOW 30?Should we expect a breakout or a rebound on DOW 30?

July 15, 2025July 15, 2025| admin-aurumadmin-aurum| 0 Comment| 11:16 am

Emerging Channel Down detected on DOW 30 – the pattern is an emerging one and has not yet broken through support, but the price is expected to move up over

Read MoreRead More

Either a rebound or a breakout imminent on USDCHFEither a rebound or a breakout imminent on USDCHF

July 15, 2025July 15, 2025| admin-aurumadmin-aurum| 0 Comment| 6:14 am

USDCHF is moving towards a line of 0.7953 which it has tested numerous times in the past. We have seen it retrace from this position in the past, so at

Read MoreRead More

A potential bearish movement on GBPUSDA potential bearish movement on GBPUSD

July 14, 2025July 14, 2025| admin-aurumadmin-aurum| 0 Comment| 10:15 pm

The movement of GBPUSD towards the support line of a Channel Down is yet another test of the line it reached numerous times in the past. This line test could

Read MoreRead More

ETHUSD approaching resistance of a Rising WedgeETHUSD approaching resistance of a Rising Wedge

July 14, 2025July 14, 2025| admin-aurumadmin-aurum| 0 Comment| 11:15 am

ETHUSD is heading towards the resistance line of a Rising Wedge. If this movement continues, the price of ETHUSD could test 3095.1200 within the next 6 hours. It has tested

Read MoreRead More

A final push possible on Nikkei 225A final push possible on Nikkei 225

July 14, 2025July 14, 2025| admin-aurumadmin-aurum| 0 Comment| 6:12 am

Nikkei 225 is about to retest a key horizontal resistance level near 39792.0000. It has tested this level 3 times in the recent past and could simply bounce off like

Read MoreRead More

Should we expect a breakout or a rebound on USDCHF?Should we expect a breakout or a rebound on USDCHF?

July 13, 2025July 13, 2025| admin-aurumadmin-aurum| 0 Comment| 10:16 pm

USDCHF was identified at around 0.79537 having recently rebounded of the resistance on the 4 hour data interval. Ultimately, the price action of the stock has formed a Descending Triangle

Read MoreRead More

Will USDCHF have enough momentum to break support?Will USDCHF have enough momentum to break support?

July 11, 2025July 11, 2025| admin-aurumadmin-aurum| 0 Comment| 11:17 am

USDCHF is heading towards the support line of a Descending Triangle. If this movement continues, the price of USDCHF could test 0.7924 within the next 2 days. It has tested

Read MoreRead More

A potential bearish movement on ASX 225A potential bearish movement on ASX 225

July 11, 2025July 11, 2025| admin-aurumadmin-aurum| 0 Comment| 6:15 am

ASX 225 is about to retest a key horizontal support level near 8496.0000. It has tested this level 4 times in the recent past and could simply bounce off like

Read MoreRead More

Should we expect a breakout or a rebound on EURUSD?Should we expect a breakout or a rebound on EURUSD?

July 10, 2025July 10, 2025| admin-aurumadmin-aurum| 0 Comment| 10:16 pm

EURUSD is heading towards the support line of a Channel Down and could reach this point within the next 21 hours. It has tested this line numerous times in the

Read MoreRead More

Should we expect a breakout or a rebound on USDCAD?Should we expect a breakout or a rebound on USDCAD?

July 10, 2025July 10, 2025| admin-aurumadmin-aurum| 0 Comment| 11:17 am

The movement of USDCAD towards 1.3631 price line is yet another test of the line it reached numerous times in the past. We could expect this test to happen in

Read MoreRead More

Posts pagination

Previous 1 … 20 21 22 … 55 Next

Recent Posts

  • 3 Point Extension Fibonacci pattern identified at 12/27 14:30. Possible bearish price movement towards target levels ranging from 454.50 to 311.16 within the next 10 days.
  • US30 Dow Jones Industrial Average Index is approaching an important level at 48456.12
  • A potential bearish move in FRA40 CAC 40 French Index
  • Trade outlook for EURAUD from 2025-12-22 05:00:00.000 until 2025-12-22 05:00:00.000
  • Gartley Fibonacci pattern identified at 12/19 14:30. This pattern is still in the process of forming. Possible bearish price movement towards target levels ranging from 238.54 to 203.78 within the next 12 days.

Recent Comments

No comments to show.
  • Technical Analysis

Search

Archives

  • December 2025
  • November 2025
  • October 2025
  • September 2025
  • August 2025
  • July 2025
  • June 2025
  • May 2025
  • April 2025
  • March 2025
  • February 2025
  • January 2025

Meta

  • Register
  • Log in

Categories

  • Technical Analysis

Educational Landing Page WordPress Theme Copyright @ 2025 Aurum Markets Limited

Back To Top