Skip to contentSkip to content
Aurum Markets Blog
  • Home
  • Technical Analysis
  • Market Insights
  • Client & IB Login
  • Register
Close Button

A final push possible on USDJPYA final push possible on USDJPY

July 20, 2025July 20, 2025| admin-aurumadmin-aurum| 0 Comment| 10:17 pm

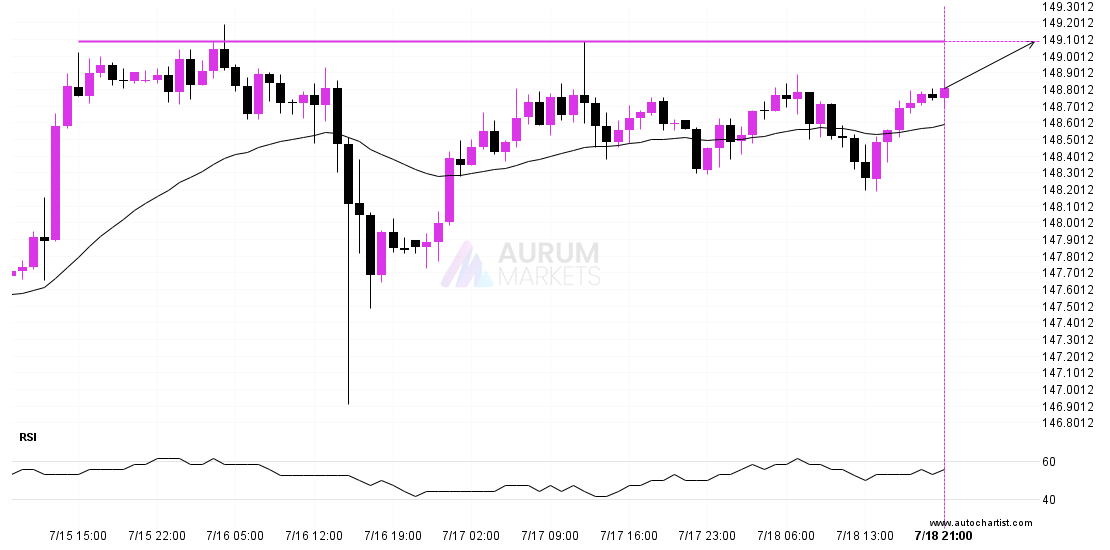
The movement of USDJPY towards 149.0890 price line is yet another test of the line it reached numerous times in the past. We could expect this test to happen in

Read MoreRead More

A final push possible on EURUSDA final push possible on EURUSD

July 18, 2025July 18, 2025| admin-aurumadmin-aurum| 0 Comment| 11:16 am

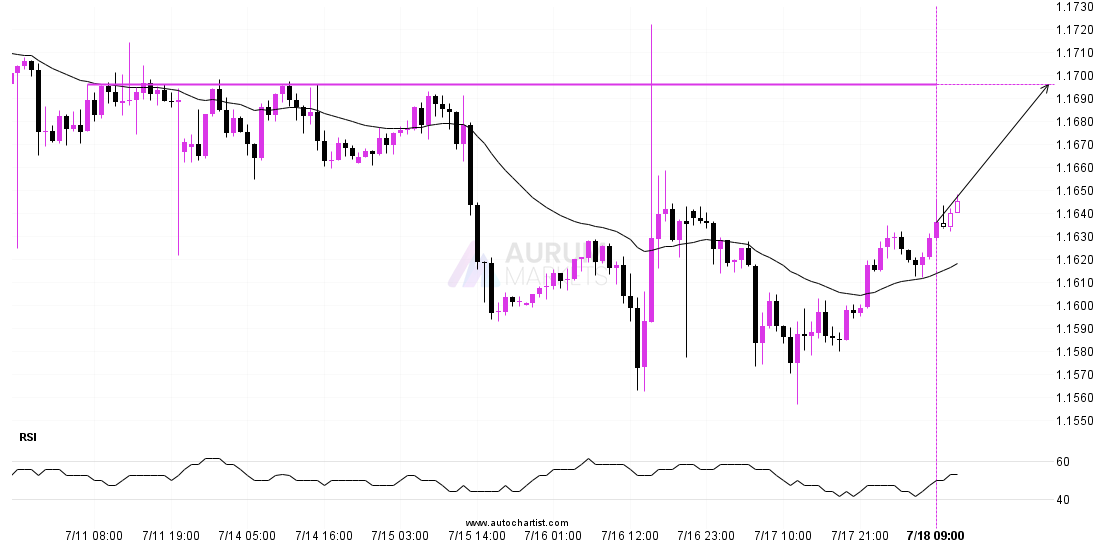
EURUSD is approaching a resistance line at 1.1696. If it hits the resistance line, it may break through this level to continue the bullish trend, or it may turn around

Read MoreRead More

A potential bearish movement on GBPUSDA potential bearish movement on GBPUSD

July 18, 2025July 18, 2025| admin-aurumadmin-aurum| 0 Comment| 6:16 am

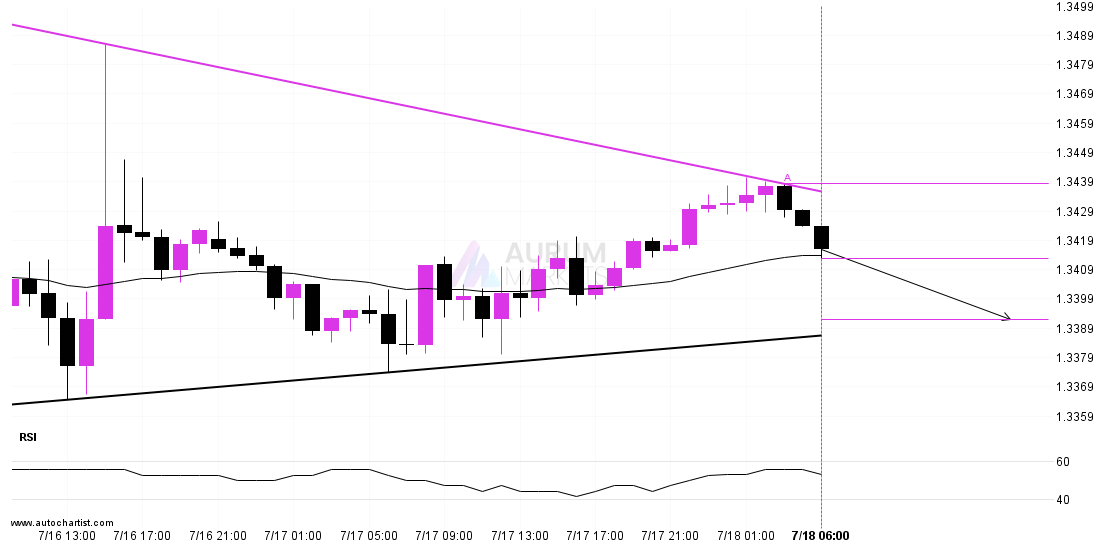
GBPUSD is heading towards the support line of a Triangle and could reach this point within the next 12 hours. It has tested this line numerous times in the past,

Read MoreRead More

BTCUSD – psychological price line breachedBTCUSD – psychological price line breached

July 17, 2025July 17, 2025| admin-aurumadmin-aurum| 0 Comment| 10:16 pm

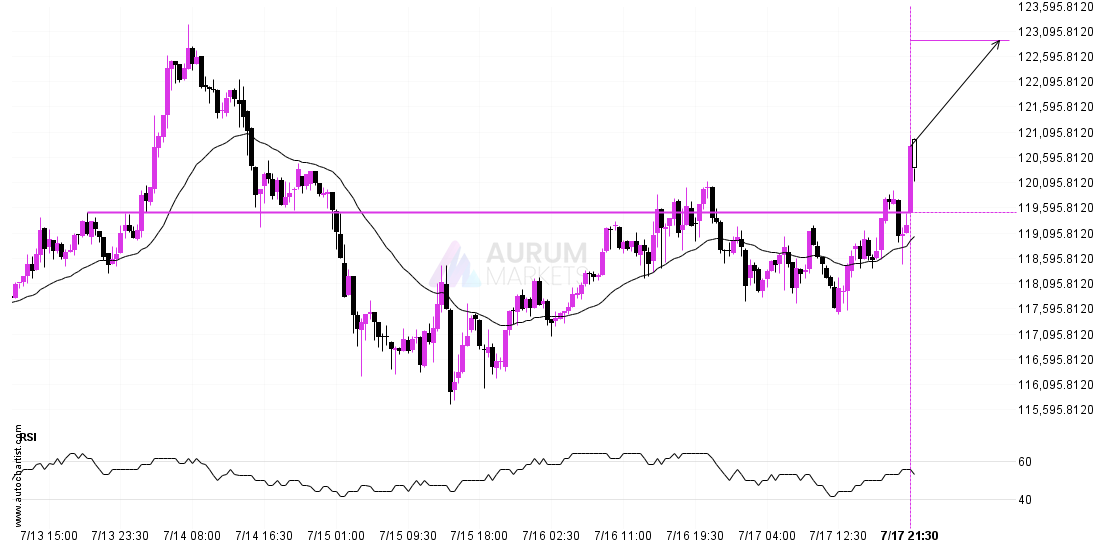
BTCUSD has broken through a resistance line. Because we have seen it retrace from this price in the past, one should wait for confirmation of the breakout before trading. It

Read MoreRead More

Possible breach of support level by DAX 40Possible breach of support level by DAX 40

July 17, 2025July 17, 2025| admin-aurumadmin-aurum| 0 Comment| 11:15 am

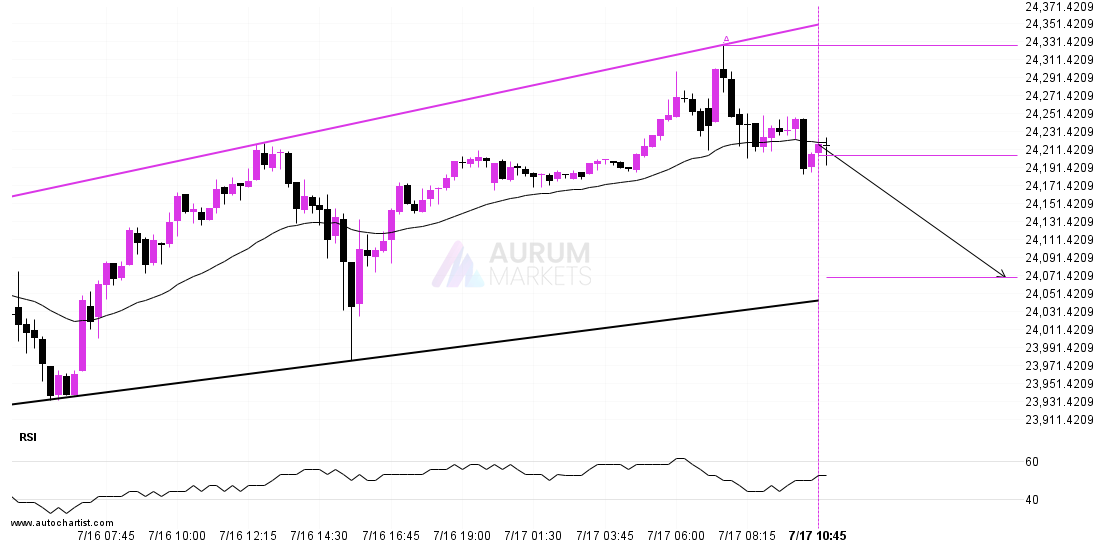
An emerging Channel Up has been detected on DAX 40 on the 15 Minutes chart. There is a possible move towards 24069.8714 next few candles. Once reaching resistance it may

Read MoreRead More

LTCUSD short term bullish trade setup to 98.2600LTCUSD short term bullish trade setup to 98.2600

July 17, 2025July 17, 2025| admin-aurumadmin-aurum| 0 Comment| 6:14 am

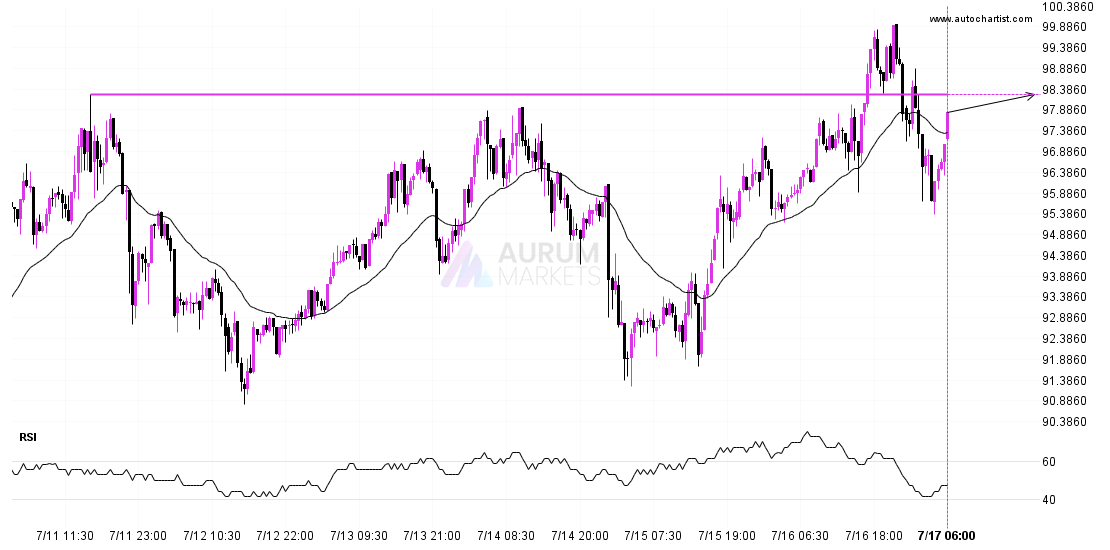
LTCUSD is approaching a resistance line at 98.2600. If it hits the resistance line, it may break through this level to continue the bullish trend, or it may turn around

Read MoreRead More

FTSE 100 approaching support of a Head and ShouldersFTSE 100 approaching support of a Head and Shoulders

July 16, 2025July 16, 2025| admin-aurumadmin-aurum| 0 Comment| 10:16 pm

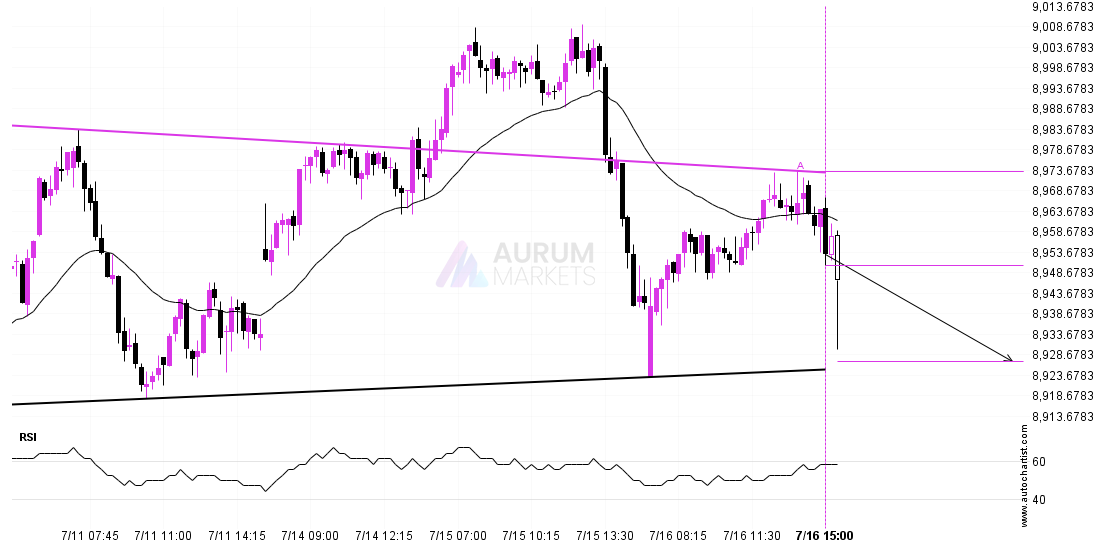
FTSE 100 is heading towards the support line of a Head and Shoulders. If this movement continues, the price of FTSE 100 could test 8926.9949 within the next 10 hours.

Read MoreRead More

A final push possible on ASX 225A final push possible on ASX 225

July 16, 2025July 16, 2025| admin-aurumadmin-aurum| 0 Comment| 11:16 am

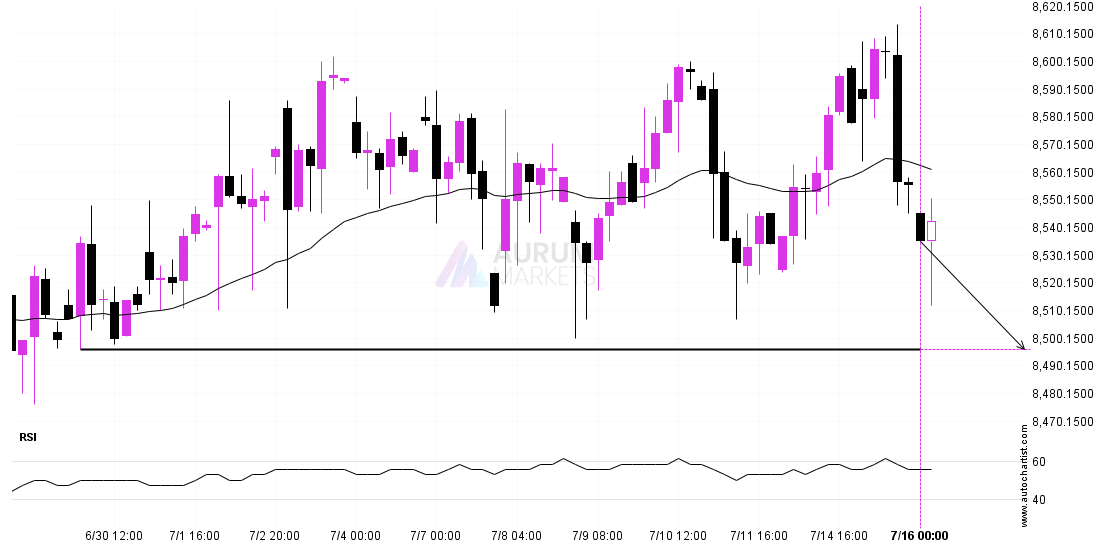
ASX 225 is approaching a support line at 8496.0000. If it hits the support line, it may break through this level to continue the bearish trend, or it may turn

Read MoreRead More

Possible breach of resistance level by ETHUSDPossible breach of resistance level by ETHUSD

July 16, 2025July 16, 2025| admin-aurumadmin-aurum| 0 Comment| 6:13 am

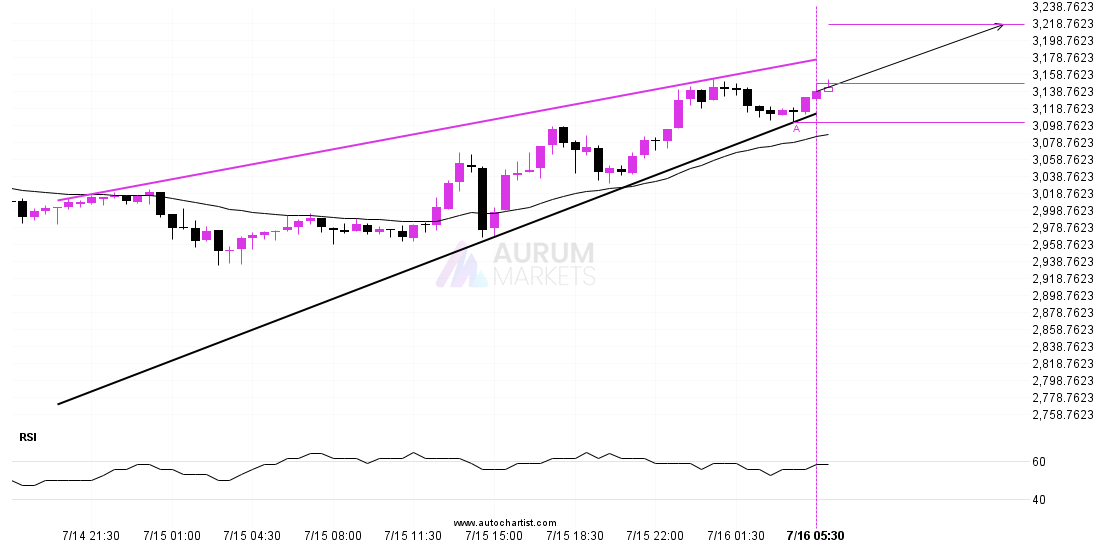
ETHUSD is heading towards the resistance line of a Rising Wedge. If this movement continues, the price of ETHUSD could test 3216.5026 within the next 10 hours. It has tested

Read MoreRead More

Breach of important price line imminent by BTCUSDBreach of important price line imminent by BTCUSD

July 15, 2025July 15, 2025| admin-aurumadmin-aurum| 0 Comment| 10:15 pm

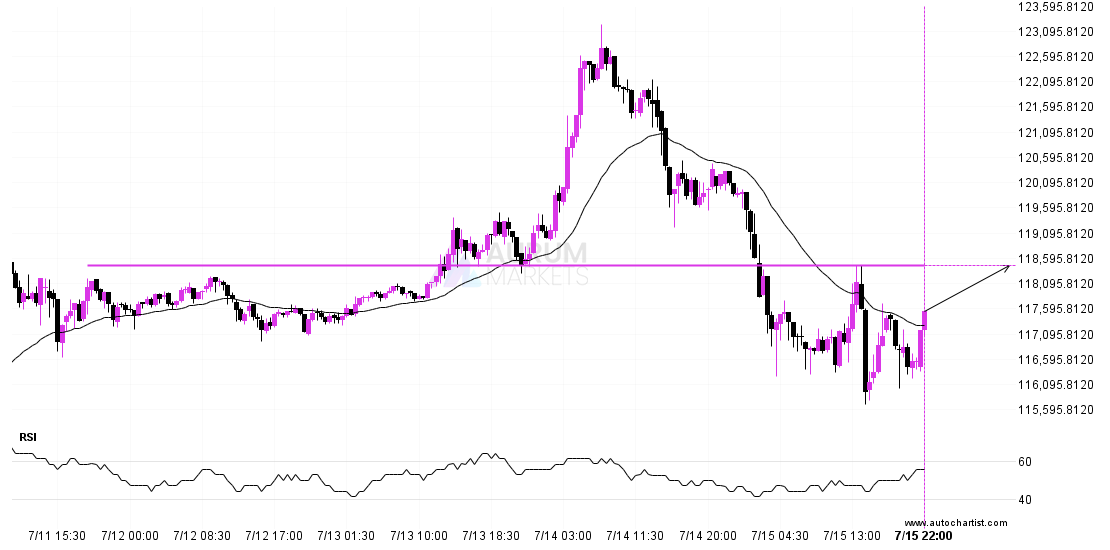
A strong resistance level has been identified at 118455.2578 on the 30 Minutes BTCUSD chart. BTCUSD is likely to test it soon. Target: 118455.2578 Entry: 117541.43 Stop: 116725.2851

Read MoreRead More

Posts pagination

Previous 1 … 19 20 21 … 55 Next

Recent Posts

  • 3 Point Extension Fibonacci pattern identified at 12/27 14:30. Possible bearish price movement towards target levels ranging from 454.50 to 311.16 within the next 10 days.
  • US30 Dow Jones Industrial Average Index is approaching an important level at 48456.12
  • A potential bearish move in FRA40 CAC 40 French Index
  • Trade outlook for EURAUD from 2025-12-22 05:00:00.000 until 2025-12-22 05:00:00.000
  • Gartley Fibonacci pattern identified at 12/19 14:30. This pattern is still in the process of forming. Possible bearish price movement towards target levels ranging from 238.54 to 203.78 within the next 12 days.

Recent Comments

No comments to show.
  • Technical Analysis

Search

Archives

  • December 2025
  • November 2025
  • October 2025
  • September 2025
  • August 2025
  • July 2025
  • June 2025
  • May 2025
  • April 2025
  • March 2025
  • February 2025
  • January 2025

Meta

  • Register
  • Log in

Categories

  • Technical Analysis

Educational Landing Page WordPress Theme Copyright @ 2025 Aurum Markets Limited

Back To Top