A potential bearish movement on GBPUSDA potential bearish movement on GBPUSD
Emerging Falling Wedge detected on GBPUSD – the pattern is an emerging one and has not yet broken through resistance, but the price is expected to move up over the

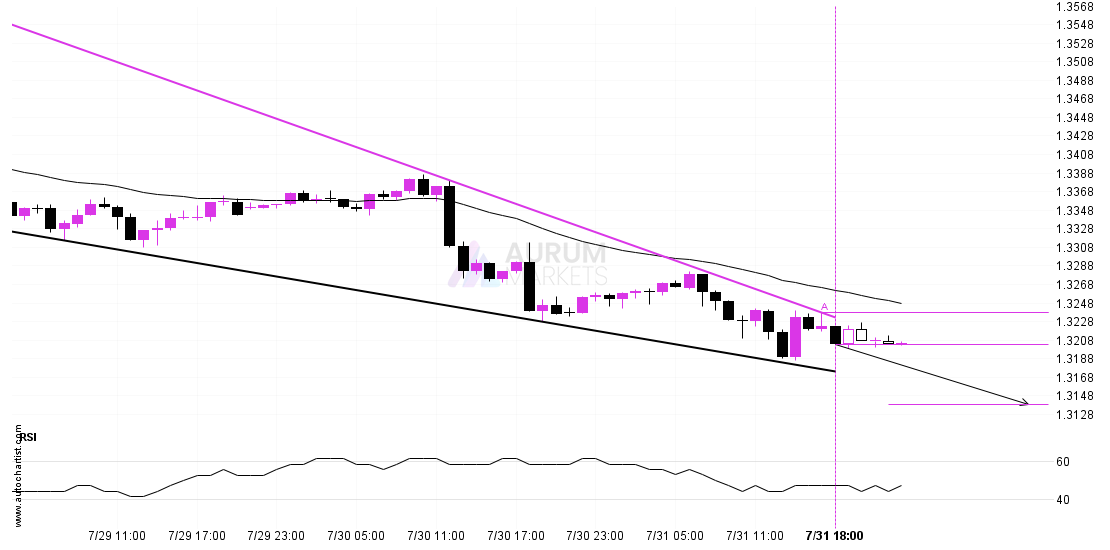
Emerging Falling Wedge detected on GBPUSD – the pattern is an emerging one and has not yet broken through resistance, but the price is expected to move up over the
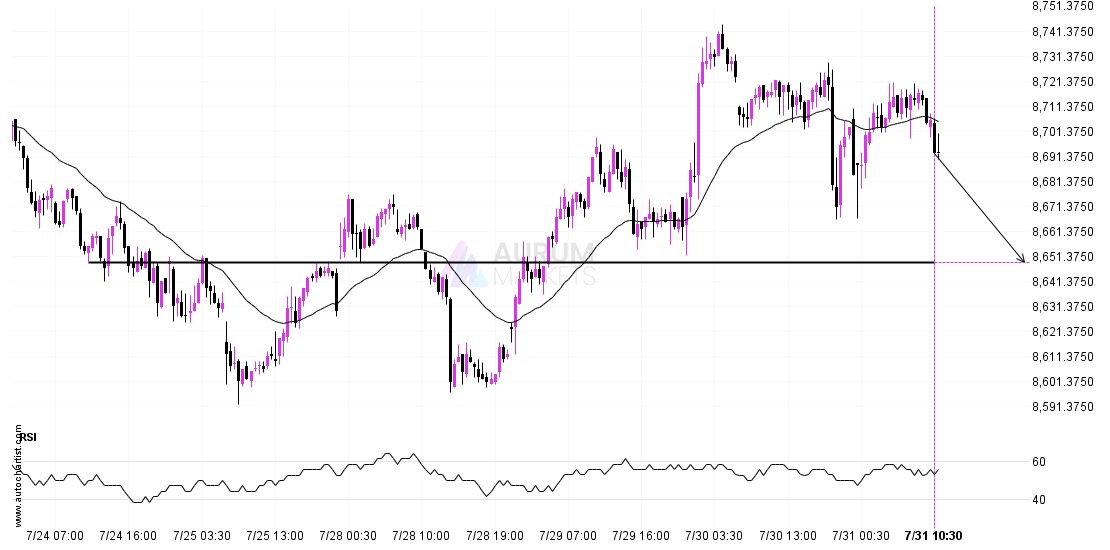
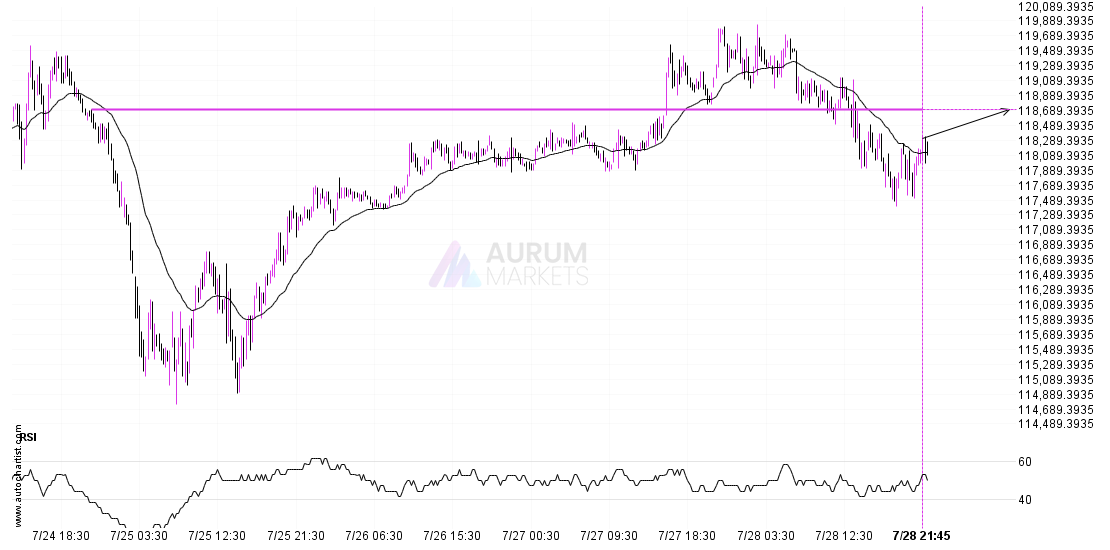
ASX 225 is moving towards a key support level at 8649.0000. ASX 225 has previously tested this level 4 times and on each occasion it has bounced back off this
Emerging Rising Wedge pattern in its final wave was identified on the ETHUSD 1 hour chart. After a strong bullish run, we find ETHUSD heading towards the upper triangle line
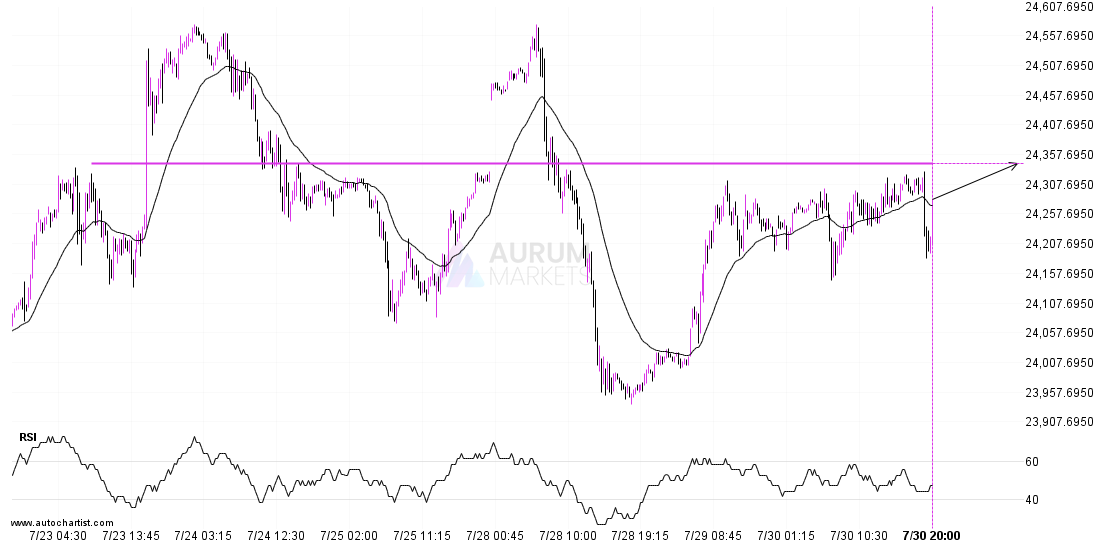
DAX 40 is heading towards 24342.9004 and could reach this point within the next 2 days. It has tested this line numerous times in the past, and this time could
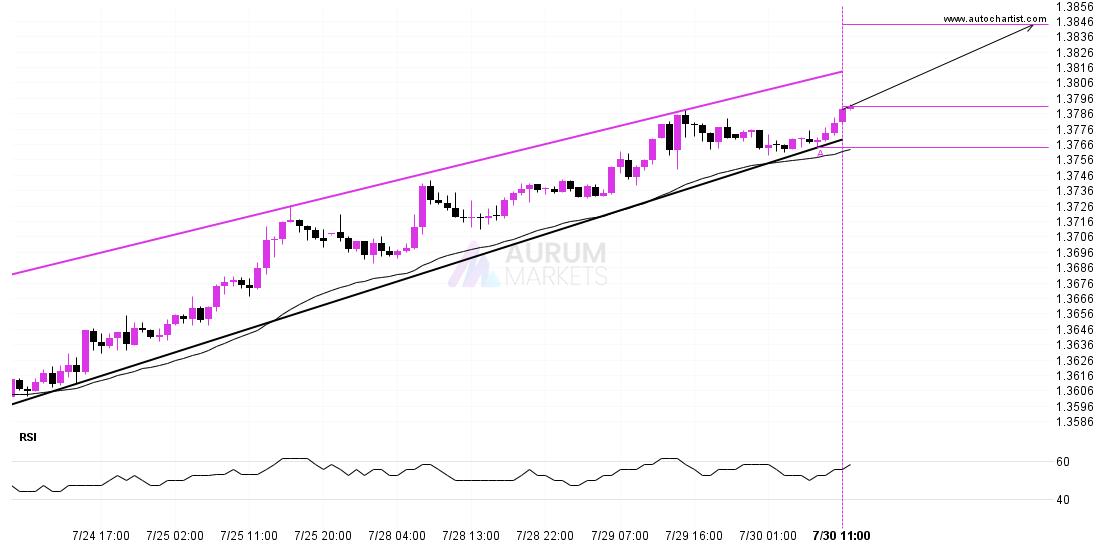
The movement of USDCAD towards the resistance line of a Channel Up is yet another test of the line it reached numerous times in the past. This line test could
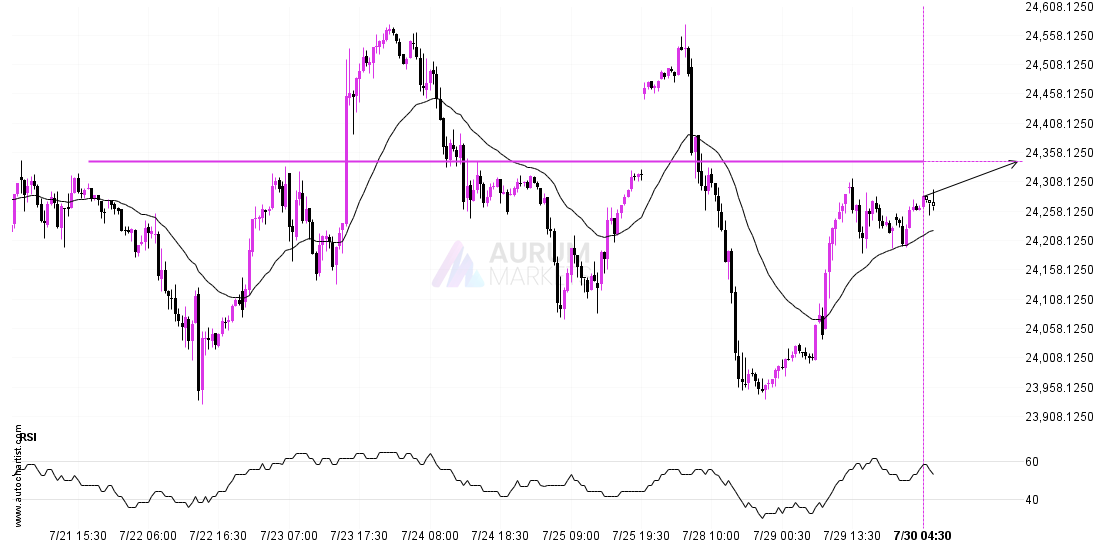
DAX 40 is heading towards 24342.9004 and could reach this point within the next 2 days. It has tested this line numerous times in the past, and this time could
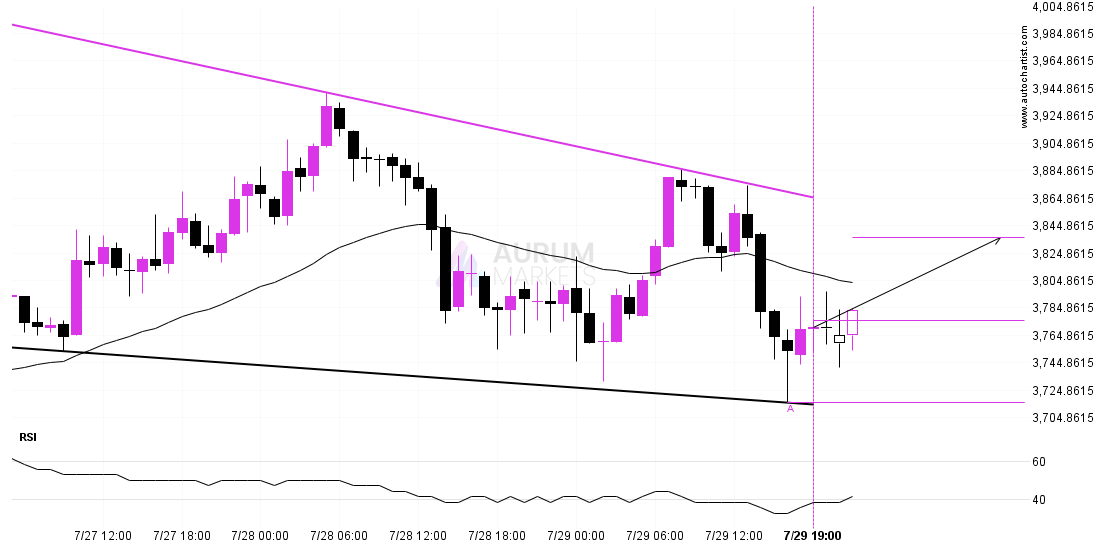
ETHUSD is approaching the resistance line of a Falling Wedge. It has touched this line numerous times in the last 3 days. If it tests this line again, it should
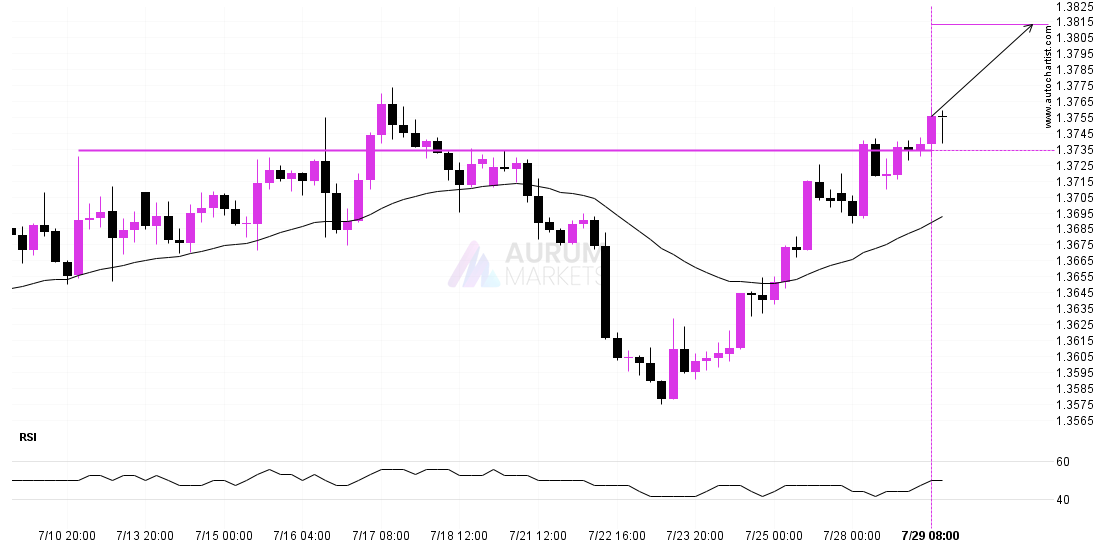
USDCAD is once again retesting a key horizontal resistance level at 1.3735. It has tested this level 4 times in the recent past and could simply bounce off like it
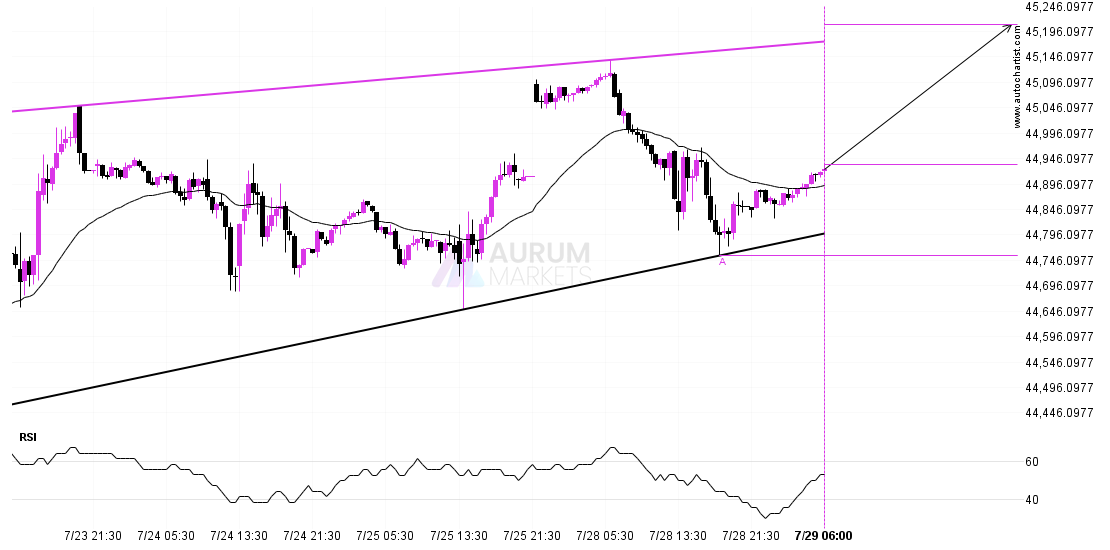
DOW 30 was identified at around 44934.44 having recently rebounded of the support on the 30 Minutes data interval. Ultimately, the price action of the stock has formed a Rising
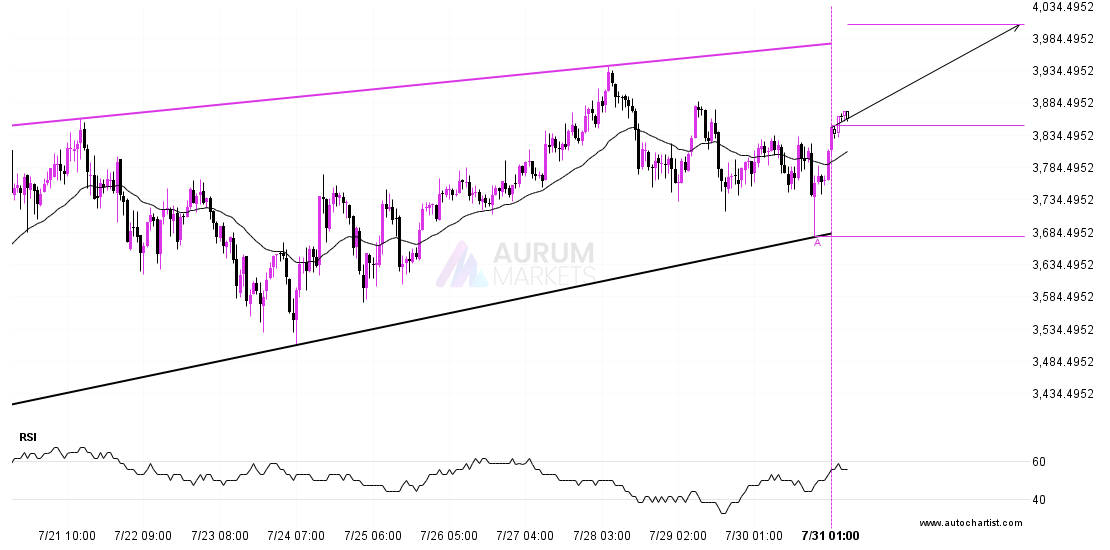
BTCUSD is en route to a very important line that will be a definite deciding factor of what is to come! We may see this trajectory continue to touch and