Skip to contentSkip to content
Aurum Markets Blog
  • Home
  • Technical Analysis
  • Market Insights
  • Client & IB Login
  • Register
Close Button

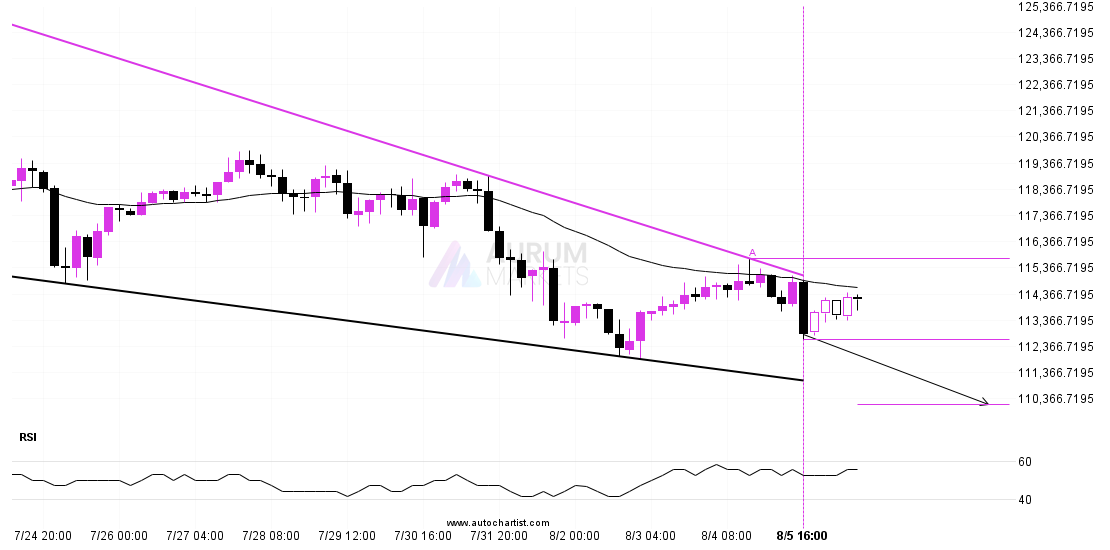
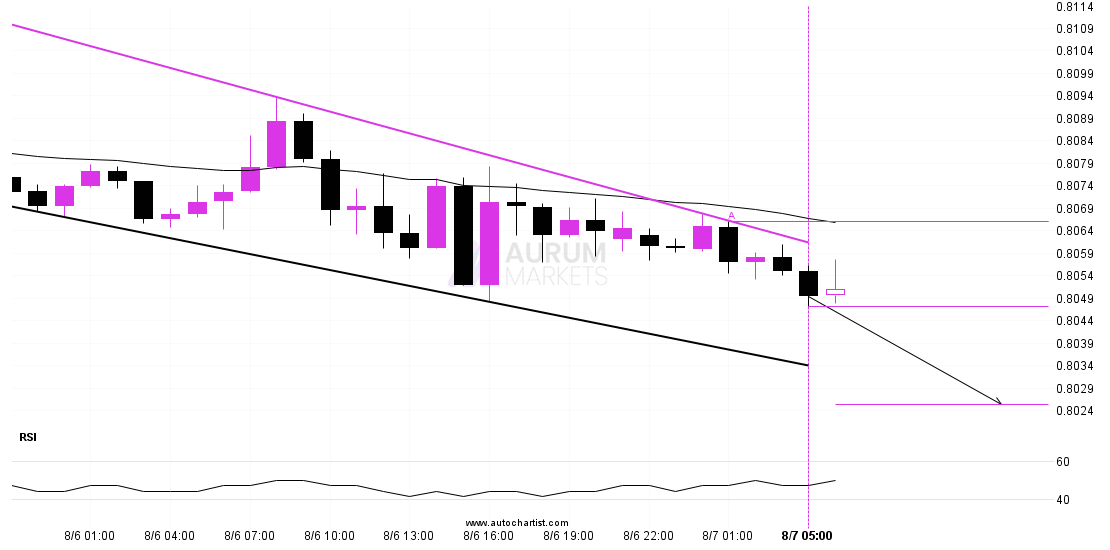
Possible breach of support level by USDCHFPossible breach of support level by USDCHF

August 7, 2025August 7, 2025| admin-aurumadmin-aurum| 0 Comment| 6:13 am

A Channel Down pattern was identified on USDCHF at 0.804765, creating an expectation that it may move to the support line at 0.8026. It may break through that line and

Read MoreRead More

Either a rebound or a breakout imminent on ETHUSDEither a rebound or a breakout imminent on ETHUSD

August 6, 2025August 6, 2025| admin-aurumadmin-aurum| 0 Comment| 10:17 pm

ETHUSD is moving towards a key resistance level at 3758.0300. ETHUSD has previously tested this level 5 times and on each occasion it has bounced back off this level. Is

Read MoreRead More

Possible breach of support level by BTCUSDPossible breach of support level by BTCUSD

August 6, 2025August 6, 2025| admin-aurumadmin-aurum| 0 Comment| 11:17 am

A Falling Wedge pattern was identified on BTCUSD at 112629.49, creating an expectation that it may move to the support line at 110173.0200. It may break through that line and

Read MoreRead More

Important price line breached by USDJPYImportant price line breached by USDJPY

August 6, 2025August 6, 2025| admin-aurumadmin-aurum| 0 Comment| 6:13 am

USDJPY has broken through a line of 147.4525 and suggests a possible movement to 146.9438 within the next 10 hours. It has tested this line numerous times in the past,

Read MoreRead More

NZDUSD – resistance line broken at 2025-08-05T22:45:00.000ZNZDUSD – resistance line broken at 2025-08-05T22:45:00.000Z

August 5, 2025August 5, 2025| admin-aurumadmin-aurum| 0 Comment| 10:15 pm

Triangle pattern identified on NZDUSD has broken through a resistance level with the price momentum continuing to move in an upward direction. A solid trading opportunity continues with the price

Read MoreRead More

BTCUSD approaches important level of 115191.1719BTCUSD approaches important level of 115191.1719

August 5, 2025August 5, 2025| admin-aurumadmin-aurum| 0 Comment| 11:15 am

The movement of BTCUSD towards 115191.1719 price line is yet another test of the line it reached numerous times in the past. We could expect this test to happen in

Read MoreRead More

Continuation pattern on AUDUSDContinuation pattern on AUDUSD

August 5, 2025August 5, 2025| admin-aurumadmin-aurum| 0 Comment| 6:15 am

AUDUSD moved through the support line of a Triangle at 0.6467065624999999 on the 1 hour chart. This line has been tested a number of times in the past and this

Read MoreRead More

A final push possible on NZDUSDA final push possible on NZDUSD

August 4, 2025August 4, 2025| admin-aurumadmin-aurum| 0 Comment| 10:14 pm

NZDUSD is about to retest a key horizontal support level near 0.5888. It has tested this level 4 times in the recent past and could simply bounce off like it

Read MoreRead More

A potential bullish movement on GBPUSDA potential bullish movement on GBPUSD

August 4, 2025August 4, 2025| admin-aurumadmin-aurum| 0 Comment| 11:15 am

GBPUSD is heading towards the resistance line of a Rising Wedge. If this movement continues, the price of GBPUSD could test 1.3344 within the next 17 hours. It has tested

Read MoreRead More

ASX 225 – getting close to support of a Channel DownASX 225 – getting close to support of a Channel Down

August 4, 2025August 4, 2025| admin-aurumadmin-aurum| 0 Comment| 6:43 am

ASX 225 is moving towards a support line. Because we have seen it retrace from this line before, we could see either a break through this line, or a rebound

Read MoreRead More

Posts pagination

Previous 1 … 15 16 17 … 55 Next

Recent Posts

  • 3 Point Extension Fibonacci pattern identified at 12/27 14:30. Possible bearish price movement towards target levels ranging from 454.50 to 311.16 within the next 10 days.
  • US30 Dow Jones Industrial Average Index is approaching an important level at 48456.12
  • A potential bearish move in FRA40 CAC 40 French Index
  • Trade outlook for EURAUD from 2025-12-22 05:00:00.000 until 2025-12-22 05:00:00.000
  • Gartley Fibonacci pattern identified at 12/19 14:30. This pattern is still in the process of forming. Possible bearish price movement towards target levels ranging from 238.54 to 203.78 within the next 12 days.

Recent Comments

No comments to show.
  • Technical Analysis

Search

Archives

  • December 2025
  • November 2025
  • October 2025
  • September 2025
  • August 2025
  • July 2025
  • June 2025
  • May 2025
  • April 2025
  • March 2025
  • February 2025
  • January 2025

Meta

  • Register
  • Log in

Categories

  • Technical Analysis

Educational Landing Page WordPress Theme Copyright @ 2025 Aurum Markets Limited

Back To Top