Skip to contentSkip to content
Aurum Markets Blog
  • Home
  • Technical Analysis
  • Market Insights
  • Client & IB Login
  • Register
Close Button

DOW 30 broke through important 44328.6992 price lineDOW 30 broke through important 44328.6992 price line

August 12, 2025August 12, 2025| admin-aurumadmin-aurum| 0 Comment| 10:14 pm

The breakout of DOW 30 through the 44328.6992 price line is a breach of an important psychological price that is has tested numerous in the past. If this breakout persists,

Read MoreRead More

ETHUSD approaching support of a TriangleETHUSD approaching support of a Triangle

August 12, 2025August 12, 2025| admin-aurumadmin-aurum| 0 Comment| 11:15 am

ETHUSD was identified at around 4286.61 having recently rebounded of the resistance on the 30 Minutes data interval. Ultimately, the price action of the stock has formed a Triangle pattern.

Read MoreRead More

AUDUSD breakout through supportAUDUSD breakout through support

August 12, 2025August 12, 2025| admin-aurumadmin-aurum| 0 Comment| 6:15 am

AUDUSD has broken through 0.6509 which it has tested numerous times in the past. We have seen it retrace from this price in the past. If this new trend persists,

Read MoreRead More

Either a rebound or a breakout imminent on DOW 30Either a rebound or a breakout imminent on DOW 30

August 11, 2025August 11, 2025| admin-aurumadmin-aurum| 0 Comment| 10:15 pm

DOW 30 is heading towards the support line of a Channel Down. If this movement continues, the price of DOW 30 could test 43634.9500 within the next 2 days. It

Read MoreRead More

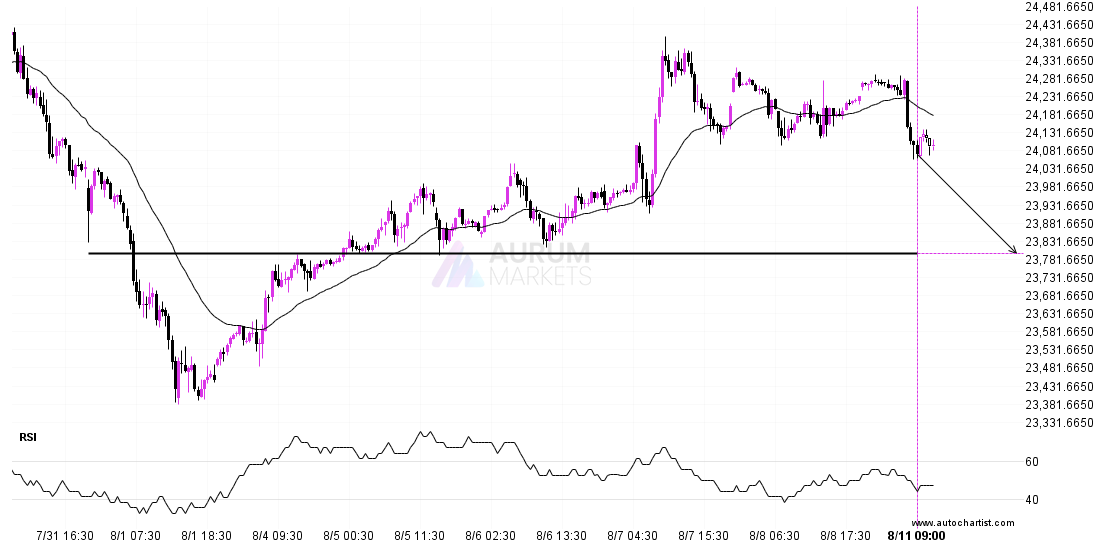
DAX 40 short term bearish trade setup to 23798.8008DAX 40 short term bearish trade setup to 23798.8008

August 11, 2025August 11, 2025| admin-aurumadmin-aurum| 0 Comment| 11:17 am

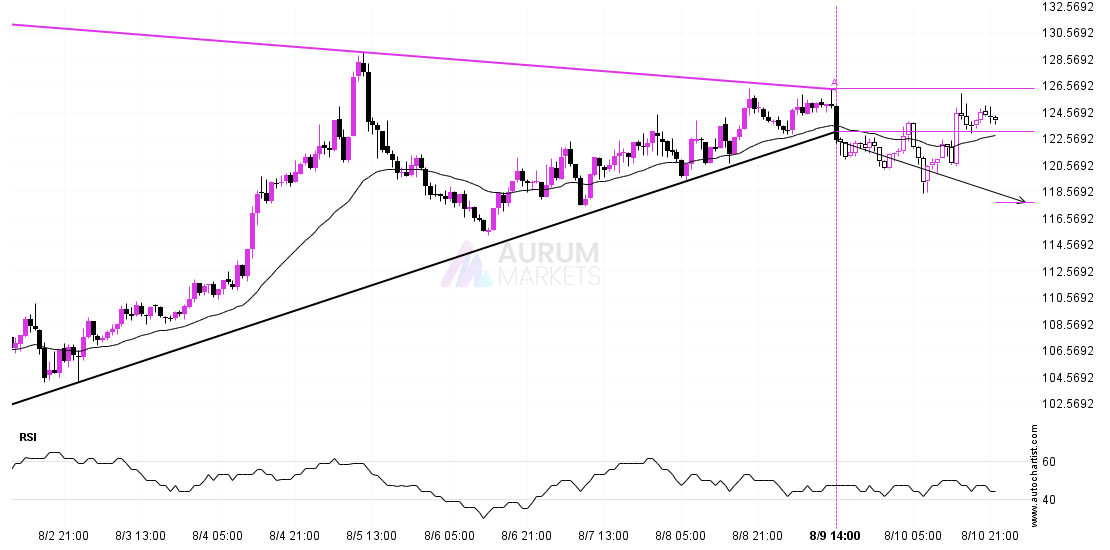
DAX 40 is moving towards a key support level at 23798.8008. DAX 40 has previously tested this level 4 times and on each occasion it has bounced back off this

Read MoreRead More

Support line breached by LTCUSDSupport line breached by LTCUSD

August 10, 2025August 10, 2025| admin-aurumadmin-aurum| 0 Comment| 10:17 pm

The breakout of LTCUSD through the support line of a Triangle could be a sign of the road ahead. If this breakout persists, we may see the price of LTCUSD

Read MoreRead More

A potential bullish movement on Nikkei 225A potential bullish movement on Nikkei 225

August 8, 2025August 8, 2025| admin-aurumadmin-aurum| 0 Comment| 11:17 am

The movement of Nikkei 225 towards the resistance line of a Rising Wedge is yet another test of the line it reached numerous times in the past. This line test

Read MoreRead More

USDCHF short term bullish trade setup to 0.8097USDCHF short term bullish trade setup to 0.8097

August 8, 2025August 8, 2025| admin-aurumadmin-aurum| 0 Comment| 6:15 am

USDCHF is approaching a resistance line at 0.8097. If it hits the resistance line, it may break through this level to continue the bullish trend, or it may turn around

Read MoreRead More

Should we expect a breakout or a rebound on NZDUSD?Should we expect a breakout or a rebound on NZDUSD?

August 7, 2025August 7, 2025| admin-aurumadmin-aurum| 0 Comment| 10:22 pm

Emerging Rising Wedge pattern in its final wave was identified on the NZDUSD 30 Minutes chart. After a strong bullish run, we find NZDUSD heading towards the upper triangle line

Read MoreRead More

LTCUSD approaching resistance levelLTCUSD approaching resistance level

August 7, 2025August 7, 2025| admin-aurumadmin-aurum| 0 Comment| 11:16 am

LTCUSD is heading towards a line of 121.4000. If this movement continues, the price of LTCUSD could test 121.4000 within the next 15 hours. But don’t be so quick to

Read MoreRead More

Posts pagination

Previous 1 … 14 15 16 … 55 Next

Recent Posts

  • 3 Point Extension Fibonacci pattern identified at 12/27 14:30. Possible bearish price movement towards target levels ranging from 454.50 to 311.16 within the next 10 days.
  • US30 Dow Jones Industrial Average Index is approaching an important level at 48456.12
  • A potential bearish move in FRA40 CAC 40 French Index
  • Trade outlook for EURAUD from 2025-12-22 05:00:00.000 until 2025-12-22 05:00:00.000
  • Gartley Fibonacci pattern identified at 12/19 14:30. This pattern is still in the process of forming. Possible bearish price movement towards target levels ranging from 238.54 to 203.78 within the next 12 days.

Recent Comments

No comments to show.
  • Technical Analysis

Search

Archives

  • December 2025
  • November 2025
  • October 2025
  • September 2025
  • August 2025
  • July 2025
  • June 2025
  • May 2025
  • April 2025
  • March 2025
  • February 2025
  • January 2025

Meta

  • Register
  • Log in

Categories

  • Technical Analysis

Educational Landing Page WordPress Theme Copyright @ 2025 Aurum Markets Limited

Back To Top