Skip to contentSkip to content
Aurum Markets Blog
  • Home
  • Technical Analysis
  • Market Insights
  • Client & IB Login
  • Register
Close Button

FTSE 100 approaching important level of 9075.2998FTSE 100 approaching important level of 9075.2998

August 18, 2025August 18, 2025| admin-aurumadmin-aurum| 0 Comment| 6:13 am

FTSE 100 is heading towards 9075.2998 and could reach this point within the next 18 hours. It has tested this line numerous times in the past, and this time could

Read MoreRead More

Should we expect a breakout or a rebound on NZDUSD?Should we expect a breakout or a rebound on NZDUSD?

August 17, 2025August 17, 2025| admin-aurumadmin-aurum| 0 Comment| 10:16 pm

NZDUSD is moving towards a support line which it has tested numerous times in the past. We have seen it retrace from this line before, so at this stage it

Read MoreRead More

USDCAD approaching important level of 1.3771USDCAD approaching important level of 1.3771

August 15, 2025August 15, 2025| admin-aurumadmin-aurum| 0 Comment| 11:16 am

USDCAD is heading towards 1.3771 and could reach this point within the next 2 days. It has tested this line numerous times in the past, and this time could be

Read MoreRead More

Either a rebound or a breakout imminent on USDJPYEither a rebound or a breakout imminent on USDJPY

August 15, 2025August 15, 2025| admin-aurumadmin-aurum| 0 Comment| 6:16 am

Emerging Falling Wedge pattern in its final wave was identified on the USDJPY 1 hour chart. After a strong bearish run, we find USDJPY heading towards the upper triangle line

Read MoreRead More

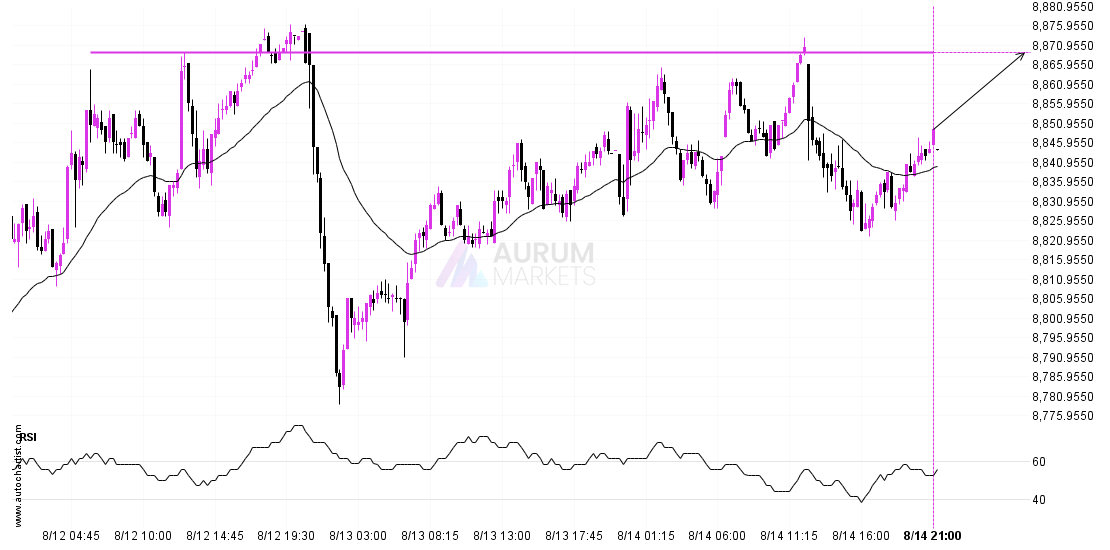
Should we expect a breakout or a rebound on ASX 225?Should we expect a breakout or a rebound on ASX 225?

August 14, 2025August 14, 2025| admin-aurumadmin-aurum| 0 Comment| 10:16 pm

ASX 225 is heading towards a line of 8869.0996. If this movement continues, the price of ASX 225 could test 8869.0996 within the next 13 hours. But don’t be so

Read MoreRead More

Should we expect a breakout or a rebound on USDCAD?Should we expect a breakout or a rebound on USDCAD?

August 14, 2025August 14, 2025| admin-aurumadmin-aurum| 0 Comment| 11:16 am

USDCAD is trapped in a Inverse Head and Shoulders formation, implying that a breakout is Imminent. This is a great trade-setup for both trend and swing traders. It is now

Read MoreRead More

Possible start of a bearish trend as USDJPY breaks supportPossible start of a bearish trend as USDJPY breaks support

August 14, 2025August 14, 2025| admin-aurumadmin-aurum| 0 Comment| 6:15 am

USDJPY has broken through a support line. Because we have seen it retrace from this price in the past, one should wait for confirmation of the breakout before trading. It

Read MoreRead More

Should we expect a breakout or a rebound on BTCUSD?Should we expect a breakout or a rebound on BTCUSD?

August 13, 2025August 13, 2025| admin-aurumadmin-aurum| 0 Comment| 10:15 pm

A Channel Up pattern was identified on BTCUSD at 122896.71, creating an expectation that it may move to the resistance line at 127154.6889. It may break through that line and

Read MoreRead More

Support breakout on USDCHFSupport breakout on USDCHF

August 13, 2025August 13, 2025| admin-aurumadmin-aurum| 0 Comment| 11:15 am

USDCHF has broken through 0.8060 which it has tested numerous times in the past. We have seen it retrace from this price in the past. If this new trend persists,

Read MoreRead More

Possible breach of resistance level by LTCUSDPossible breach of resistance level by LTCUSD

August 13, 2025August 13, 2025| admin-aurumadmin-aurum| 0 Comment| 6:15 am

Emerging Channel Up detected on LTCUSD – the pattern is an emerging one and has not yet broken through support, but the price is expected to move up over the

Read MoreRead More

Posts pagination

Previous 1 … 13 14 15 … 55 Next

Recent Posts

  • 3 Point Extension Fibonacci pattern identified at 12/27 14:30. Possible bearish price movement towards target levels ranging from 454.50 to 311.16 within the next 10 days.
  • US30 Dow Jones Industrial Average Index is approaching an important level at 48456.12
  • A potential bearish move in FRA40 CAC 40 French Index
  • Trade outlook for EURAUD from 2025-12-22 05:00:00.000 until 2025-12-22 05:00:00.000
  • Gartley Fibonacci pattern identified at 12/19 14:30. This pattern is still in the process of forming. Possible bearish price movement towards target levels ranging from 238.54 to 203.78 within the next 12 days.

Recent Comments

No comments to show.
  • Technical Analysis

Search

Archives

  • December 2025
  • November 2025
  • October 2025
  • September 2025
  • August 2025
  • July 2025
  • June 2025
  • May 2025
  • April 2025
  • March 2025
  • February 2025
  • January 2025

Meta

  • Register
  • Log in

Categories

  • Technical Analysis

Educational Landing Page WordPress Theme Copyright @ 2025 Aurum Markets Limited

Back To Top