Skip to contentSkip to content
Aurum Markets Blog
  • Home
  • Technical Analysis
  • Market Insights
  • Client & IB Login
  • Register
Close Button

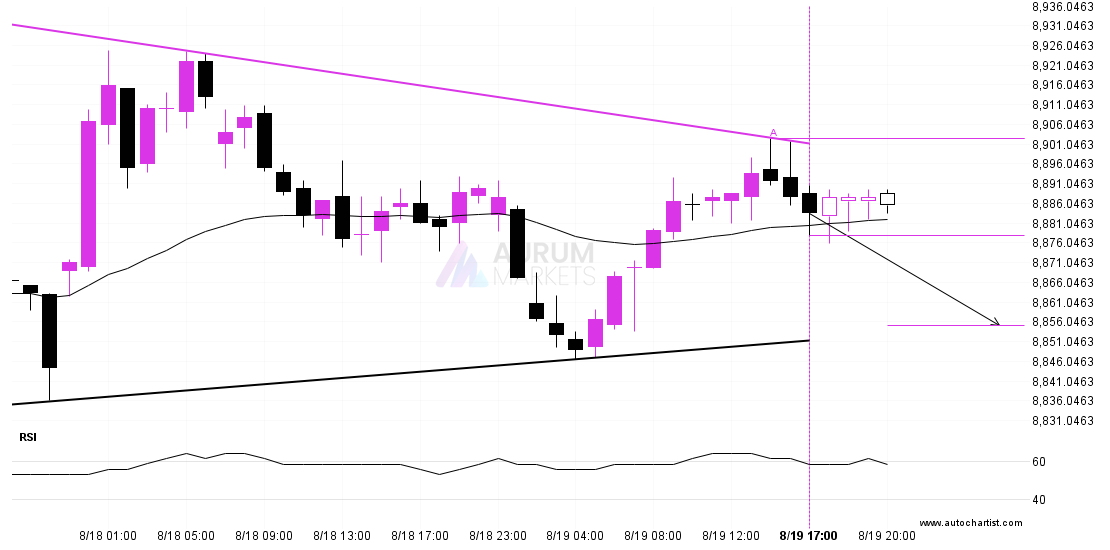
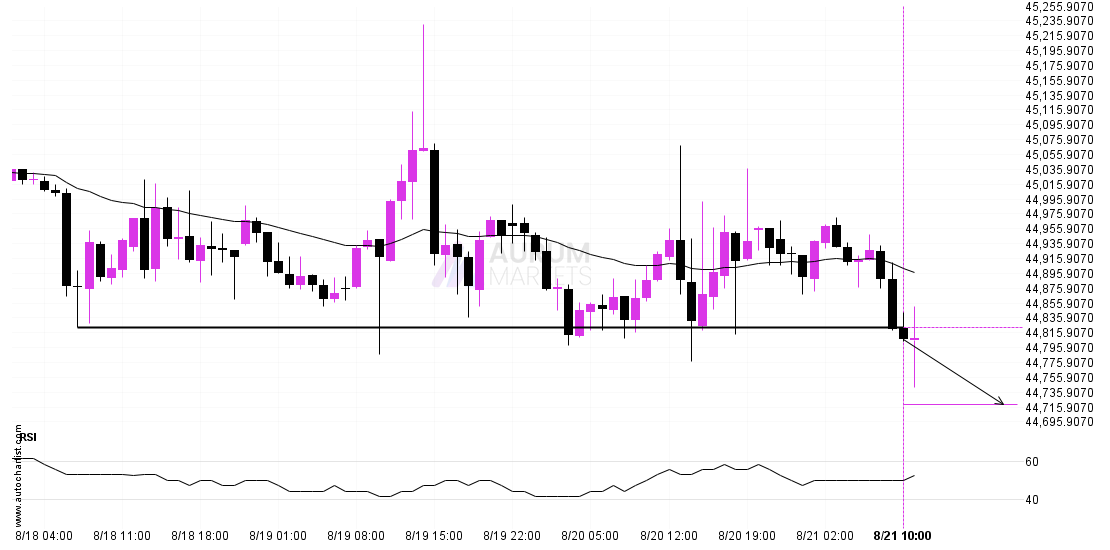
Confirmed breakout on DOW 30 1 hour chartConfirmed breakout on DOW 30 1 hour chart

August 21, 2025August 21, 2025| admin-aurumadmin-aurum| 0 Comment| 11:16 am

The price of DOW 30 in heading in the direction of 44720.0508. Despite the recent breakout through 44823.4688 it is possible that it will struggle to gain momentum to the

Read MoreRead More

Will ETHUSD have enough momentum to break resistance?Will ETHUSD have enough momentum to break resistance?

August 21, 2025August 21, 2025| admin-aurumadmin-aurum| 0 Comment| 6:17 am

ETHUSD is trapped in a Flag formation, implying that a breakout is Imminent. This is a great trade-setup for both trend and swing traders. It is now approaching a support

Read MoreRead More

BTCUSD approaching resistance levelBTCUSD approaching resistance level

August 20, 2025August 20, 2025| admin-aurumadmin-aurum| 0 Comment| 10:20 pm

The movement of BTCUSD towards 115925.5391 price line is yet another test of the line it reached numerous times in the past. We could expect this test to happen in

Read MoreRead More

USDJPY – Reversal Chart Pattern – Rising WedgeUSDJPY – Reversal Chart Pattern – Rising Wedge

August 20, 2025August 20, 2025| admin-aurumadmin-aurum| 0 Comment| 11:17 am

USDJPY is heading towards the resistance line of a Rising Wedge and could reach this point within the next 2 days. It has tested this line numerous times in the

Read MoreRead More

ETHUSD – psychological price line breachedETHUSD – psychological price line breached

August 20, 2025August 20, 2025| admin-aurumadmin-aurum| 0 Comment| 6:15 am

ETHUSD has broken through 4161.6099 which it has tested numerous times in the past. We have seen it retrace from this price in the past. If this new trend persists,

Read MoreRead More

Possible breach of support level by ASX 225Possible breach of support level by ASX 225

August 19, 2025August 19, 2025| admin-aurumadmin-aurum| 0 Comment| 10:18 pm

ASX 225 is moving towards a support line which it has tested numerous times in the past. We have seen it retrace from this line before, so at this stage

Read MoreRead More

Should we expect a breakout or a rebound on USDCHF?Should we expect a breakout or a rebound on USDCHF?

August 19, 2025August 19, 2025| admin-aurumadmin-aurum| 0 Comment| 11:15 am

A strong support level has been identified at 0.8043 on the 4 hour USDCHF chart. USDCHF is likely to test it soon. Supported by Downward sloping Moving Average Target: 0.8043

Read MoreRead More

Either a rebound or a breakout imminent on LTCUSDEither a rebound or a breakout imminent on LTCUSD

August 19, 2025August 19, 2025| admin-aurumadmin-aurum| 0 Comment| 6:14 am

An emerging Falling Wedge has been detected on LTCUSD on the 1 hour chart. There is a possible move towards 114.4363 next few candles. Once reaching resistance it may continue

Read MoreRead More

BTCUSD approaching resistance levelBTCUSD approaching resistance level

August 18, 2025August 18, 2025| admin-aurumadmin-aurum| 0 Comment| 10:16 pm

BTCUSD is approaching a resistance line at 118639.8125. If it hits the resistance line, it may break through this level to continue the bullish trend, or it may turn around

Read MoreRead More

Rising Wedge breakout on FTSE 100Rising Wedge breakout on FTSE 100

August 18, 2025August 18, 2025| admin-aurumadmin-aurum| 0 Comment| 11:17 am

Rising Wedge pattern identified on FTSE 100 has broken through a support level with the price momentum continuing to move in an downward direction. A solid trading opportunity continues with

Read MoreRead More

Posts pagination

Previous 1 … 12 13 14 … 55 Next

Recent Posts

  • 3 Point Extension Fibonacci pattern identified at 12/27 14:30. Possible bearish price movement towards target levels ranging from 454.50 to 311.16 within the next 10 days.
  • US30 Dow Jones Industrial Average Index is approaching an important level at 48456.12
  • A potential bearish move in FRA40 CAC 40 French Index
  • Trade outlook for EURAUD from 2025-12-22 05:00:00.000 until 2025-12-22 05:00:00.000
  • Gartley Fibonacci pattern identified at 12/19 14:30. This pattern is still in the process of forming. Possible bearish price movement towards target levels ranging from 238.54 to 203.78 within the next 12 days.

Recent Comments

No comments to show.
  • Technical Analysis

Search

Archives

  • December 2025
  • November 2025
  • October 2025
  • September 2025
  • August 2025
  • July 2025
  • June 2025
  • May 2025
  • April 2025
  • March 2025
  • February 2025
  • January 2025

Meta

  • Register
  • Log in

Categories

  • Technical Analysis

Educational Landing Page WordPress Theme Copyright @ 2025 Aurum Markets Limited

Back To Top