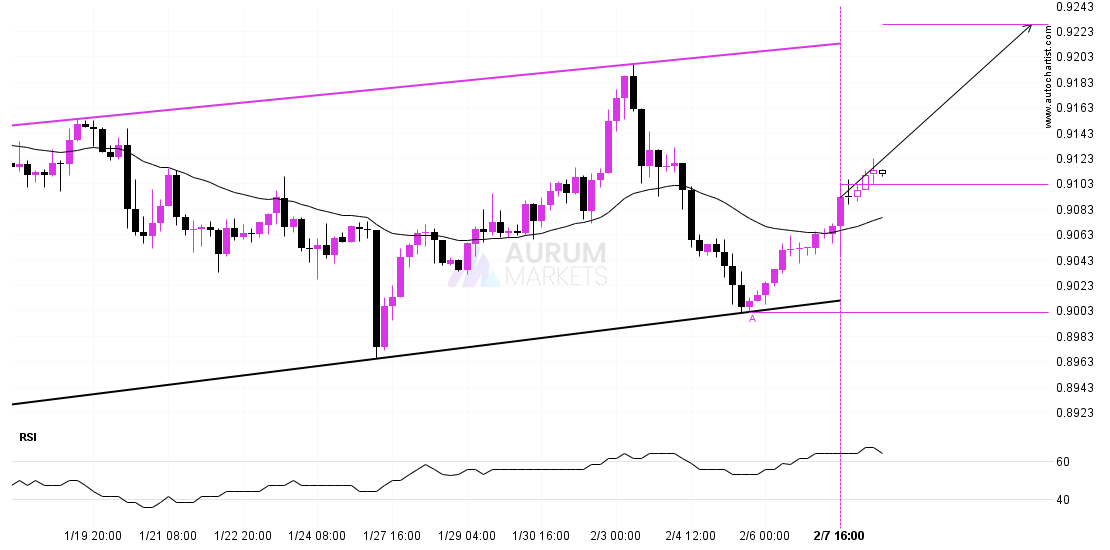
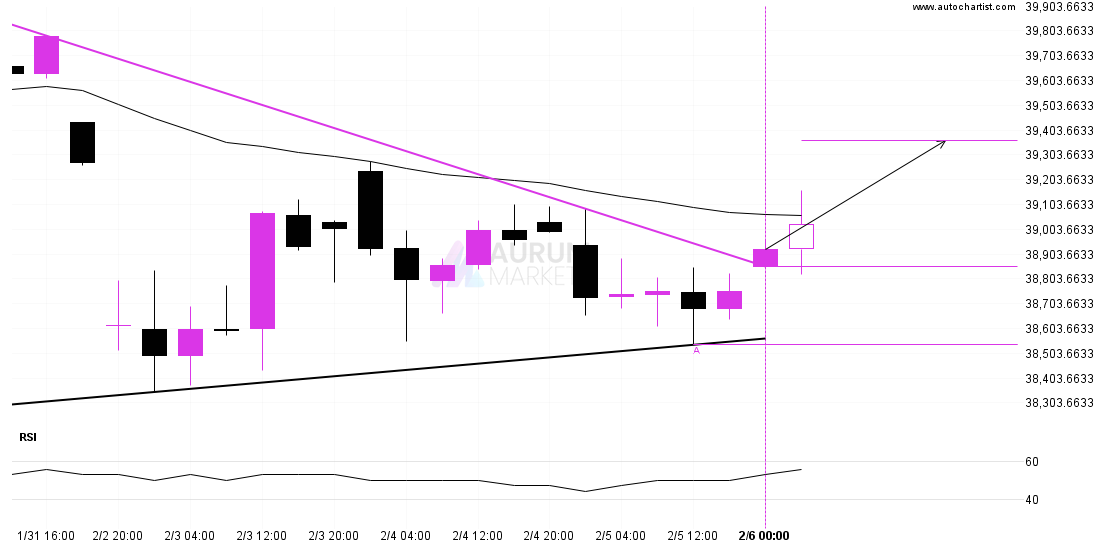
Important price line breached by USDCADImportant price line breached by USDCAD
A strong support level has been breached at 1.4312 on the 4 hour USDCAD chart. Technical Analysis theory forecasts a movement to 1.4227 in the next 3 days. Supported by
Technical Analysis
A strong support level has been breached at 1.4312 on the 4 hour USDCAD chart. Technical Analysis theory forecasts a movement to 1.4227 in the next 3 days. Supported by
Nikkei 225 has broken through a resistance line. It has touched this line at least twice in the last 10 days. This breakout may indicate a potential move to 39361.7657
LTCUSD is about to retest a key horizontal support level near 101.0400. It has tested this level 5 times in the recent past and could simply bounce off like it
ASX 225 is heading towards the resistance line of a Triangle and could reach this point within the next 10 hours. It has tested this line numerous times in the
FTSE 100 is en route to a very important line that will be a definite deciding factor of what is to come! We may see this trajectory continue to touch
ETHUSD moved through the support line of a Triangle at 2806.8060810810807 on the 30 Minutes chart. This line has been tested a number of times in the past and this
USDCHF has broken through a line of 0.9089 and suggests a possible movement to 0.9049 within the next 14 hours. It has tested this line numerous times in the past,
Nikkei 225 was identified at around 39125.0 having recently rebounded of the support on the 4 hour data interval. Ultimately, the price action of the stock has formed a Falling
USDCAD is approaching a support line at 1.4366. If it hits the support line, it may break through this level to continue the bearish trend, or it may turn around
Emerging Rectangle pattern in its final wave was identified on the USDJPY 1 hour chart. After a strong bearish run, we find USDJPY heading towards the upper triangle line with