A potential bearish movement on DAX 40A potential bearish movement on DAX 40
DAX 40 is heading towards the support line of a Falling Wedge. If this movement continues, the price of DAX 40 could test 23655.1724 within the next 5 hours. It

Technical Analysis
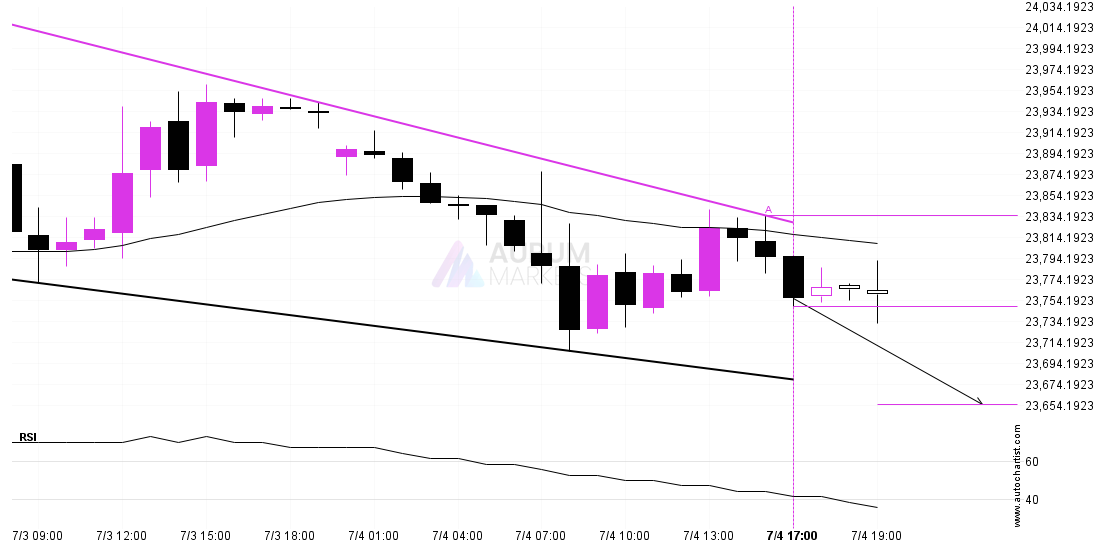
DAX 40 is heading towards the support line of a Falling Wedge. If this movement continues, the price of DAX 40 could test 23655.1724 within the next 5 hours. It
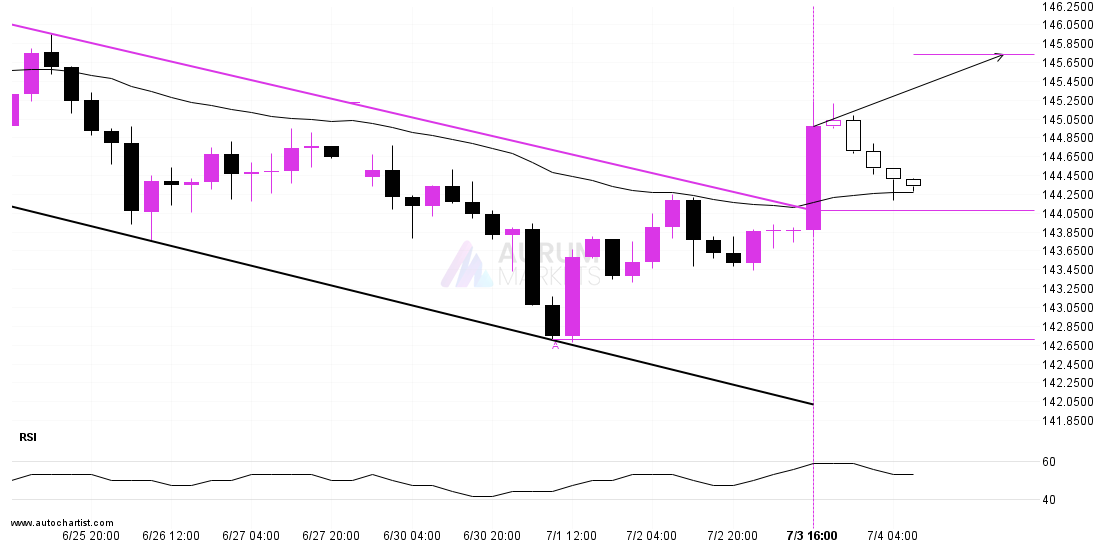
USDJPY has broken through the resistance line which it has tested twice in the past. We have seen it retrace from this line before, so one should wait for confirmation
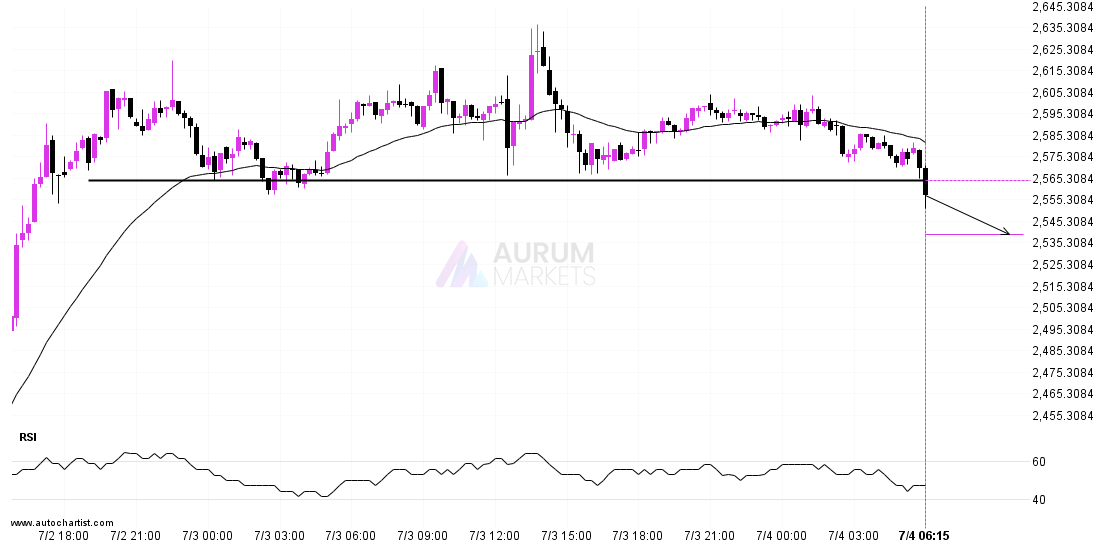
ETHUSD has breached the support line at 2564.1599. It may continue the bearish trend towards 2539.2749, or, it may prove to be yet another test of this level. Supported by
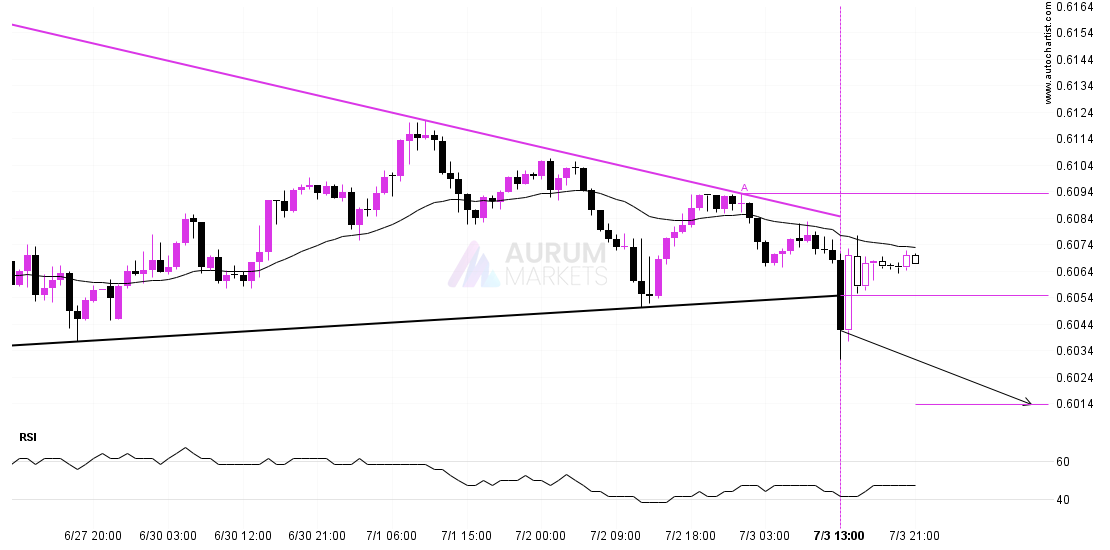
This trade setup on NZDUSD is formed by a period of consolidation; a period in which the price primarily moves sideways before choosing a new direction for the longer term.
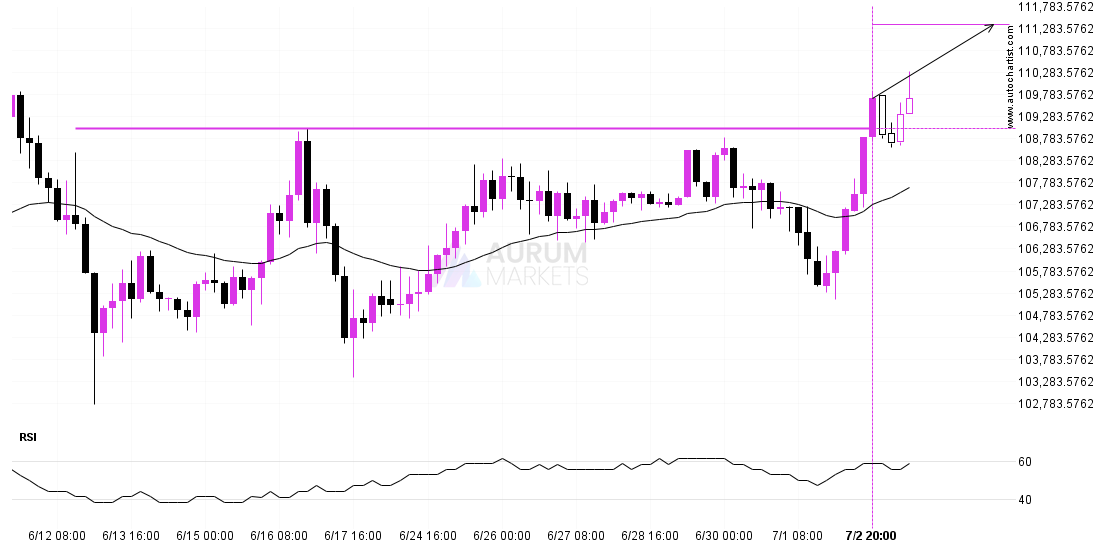
The price of BTCUSD in heading in the direction of 111354.5078. Despite the recent breakout through 109014.3281 it is possible that it will struggle to gain momentum to the forecast

Nikkei 225 moved through the support line of a Triangle at 39700.0 on the 30 Minutes chart. This line has been tested a number of times in the past and

FTSE 100 is about to retest a key horizontal support level near 8708.4297. It has tested this level 3 times in the recent past and could simply bounce off like
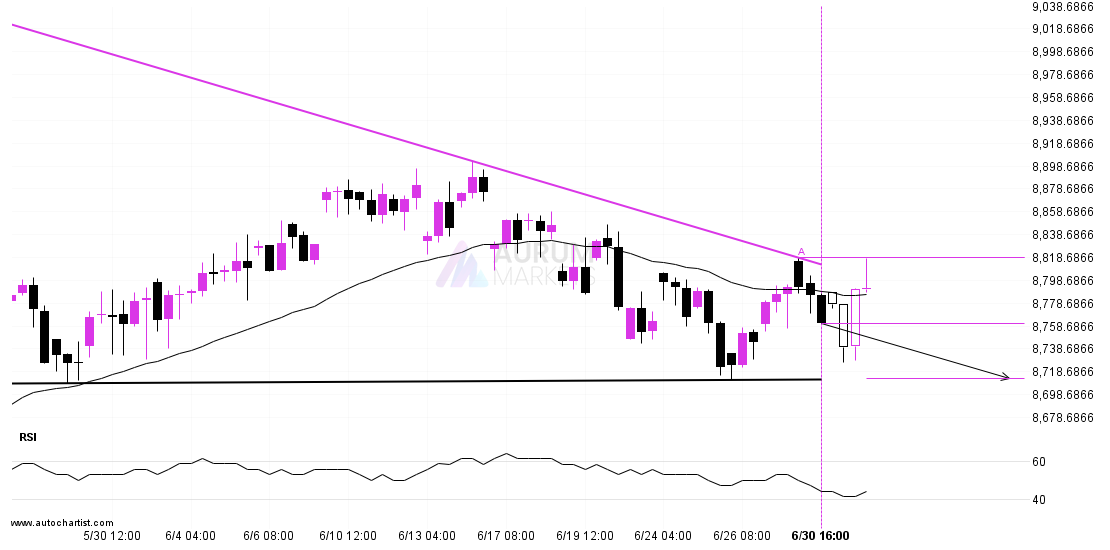
Emerging Descending Triangle detected on FTSE 100 – the pattern is an emerging one and has not yet broken through resistance, but the price is expected to move up over
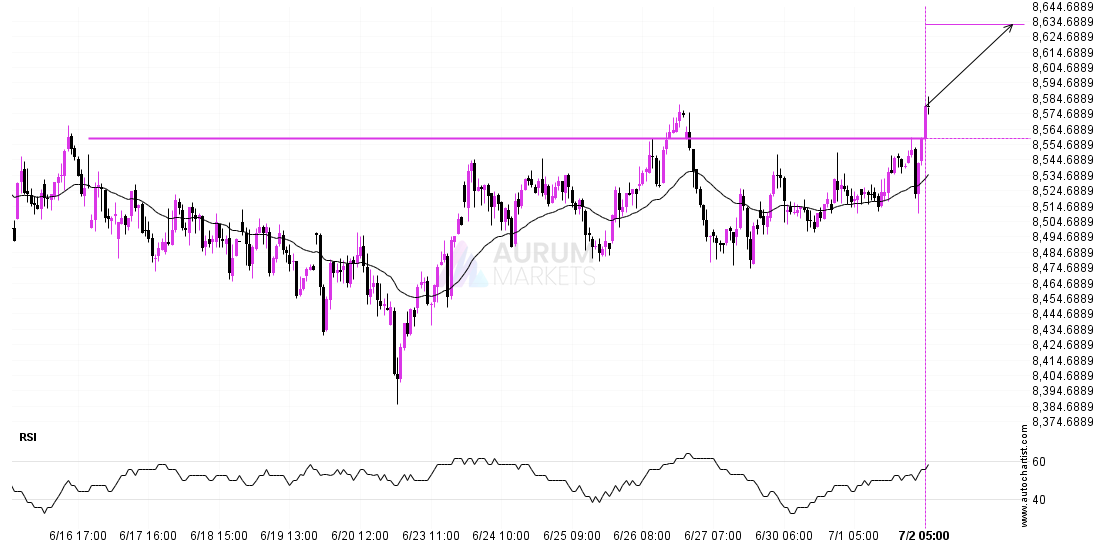
ASX 225 has broken through a line of 8558.5996 and suggests a possible movement to 8632.3799 within the next 3 days. It has tested this line numerous times in the

Emerging Channel Down pattern in its final wave was identified on the Nikkei 225 15 Minutes chart. After a strong bearish run, we find Nikkei 225 heading towards the upper