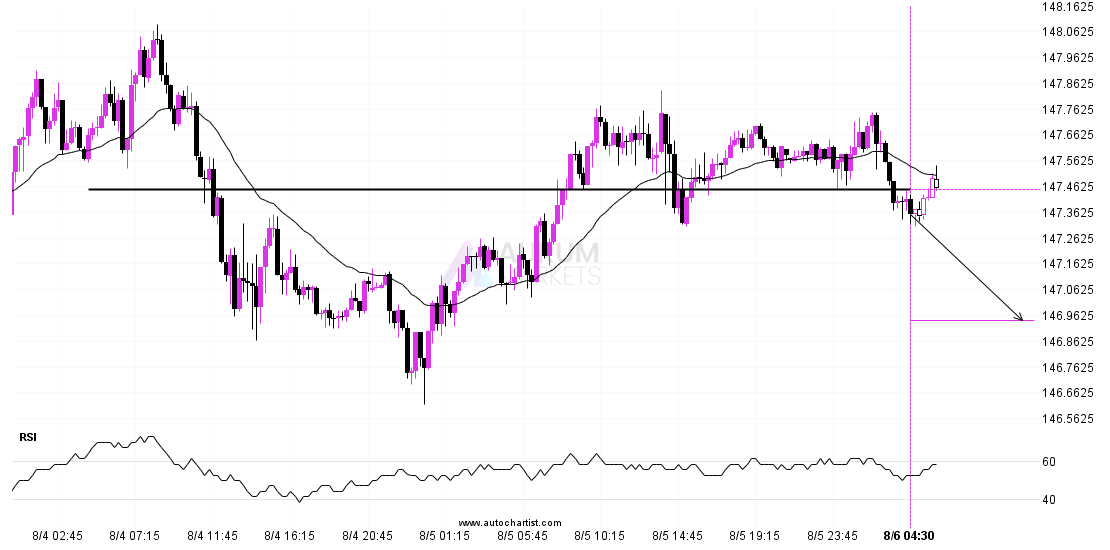
Important price line breached by USDJPYImportant price line breached by USDJPY
USDJPY has broken through a line of 147.4525 and suggests a possible movement to 146.9438 within the next 10 hours. It has tested this line numerous times in the past,

Technical Analysis
USDJPY has broken through a line of 147.4525 and suggests a possible movement to 146.9438 within the next 10 hours. It has tested this line numerous times in the past,
Triangle pattern identified on NZDUSD has broken through a resistance level with the price momentum continuing to move in an upward direction. A solid trading opportunity continues with the price
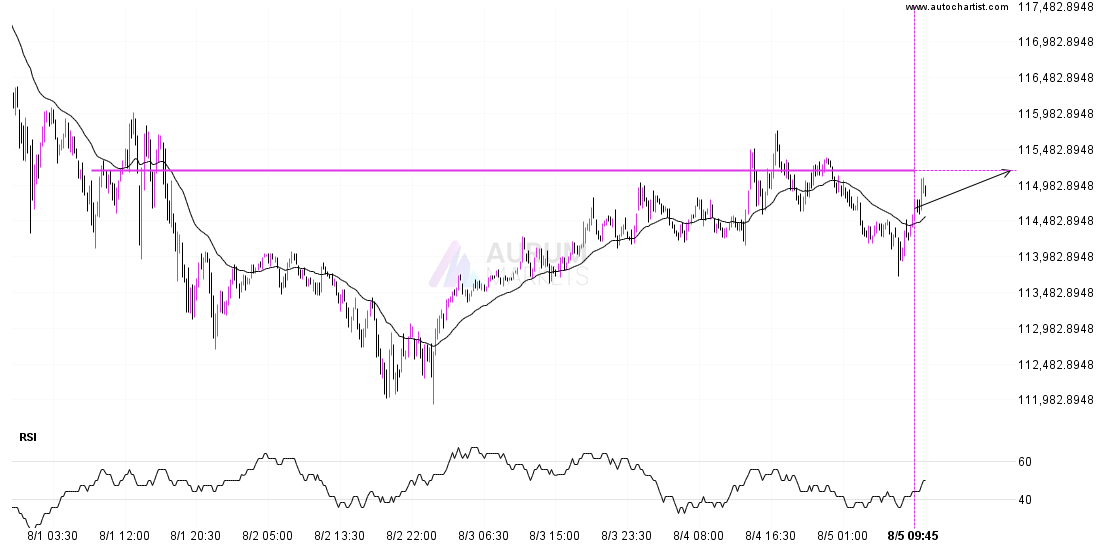
The movement of BTCUSD towards 115191.1719 price line is yet another test of the line it reached numerous times in the past. We could expect this test to happen in
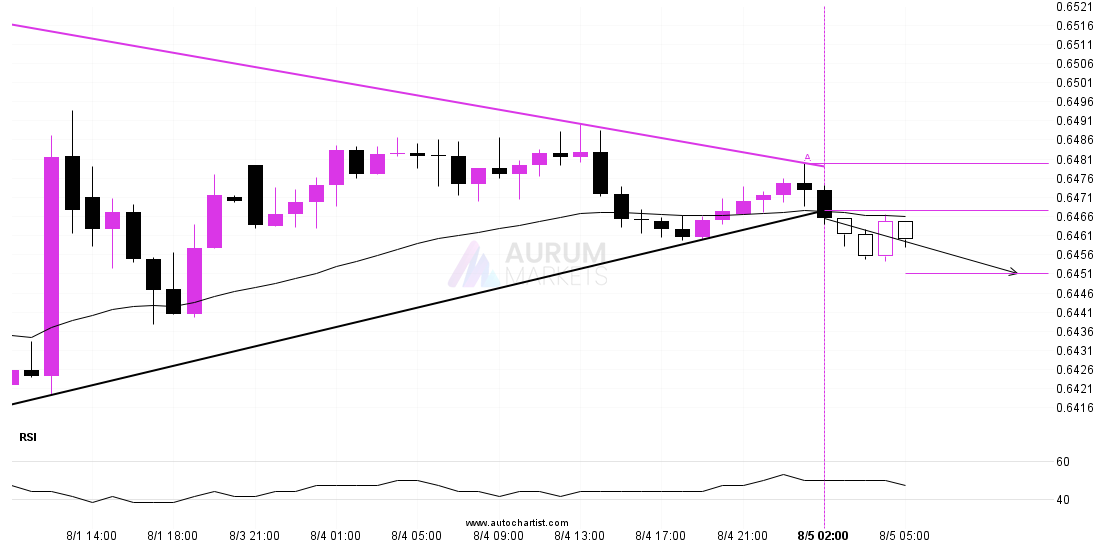
AUDUSD moved through the support line of a Triangle at 0.6467065624999999 on the 1 hour chart. This line has been tested a number of times in the past and this
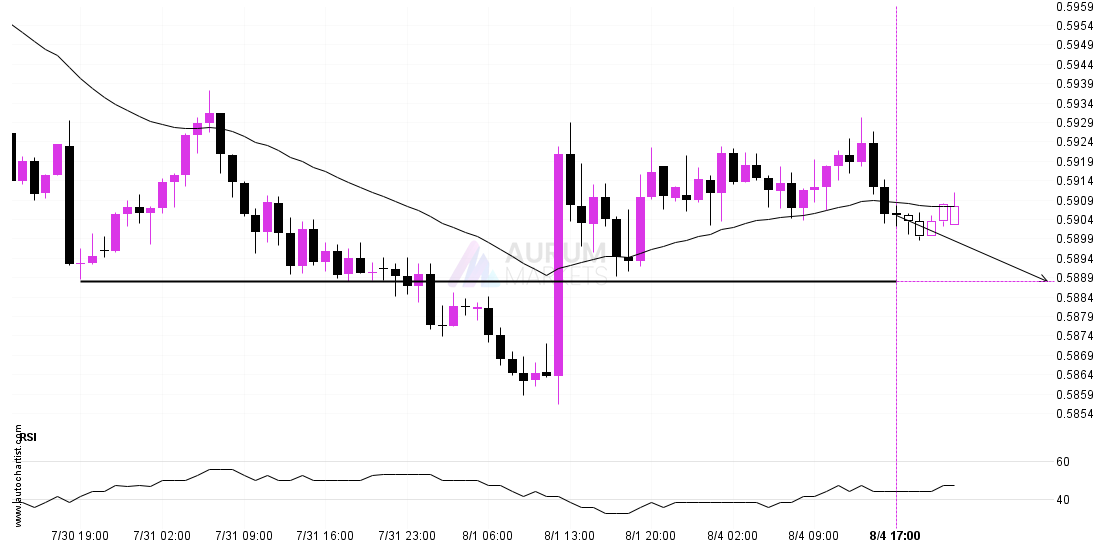
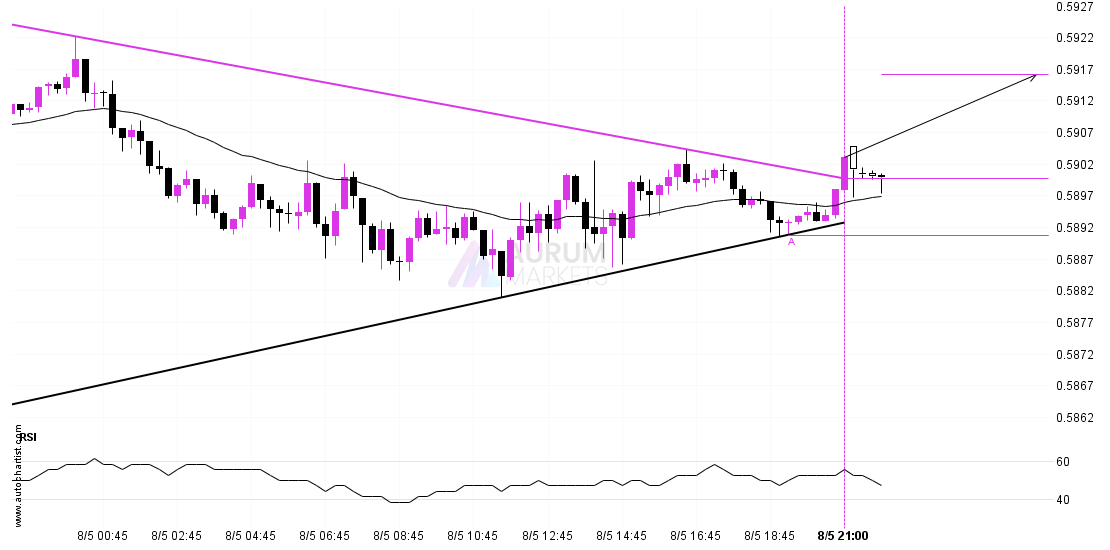
NZDUSD is about to retest a key horizontal support level near 0.5888. It has tested this level 4 times in the recent past and could simply bounce off like it
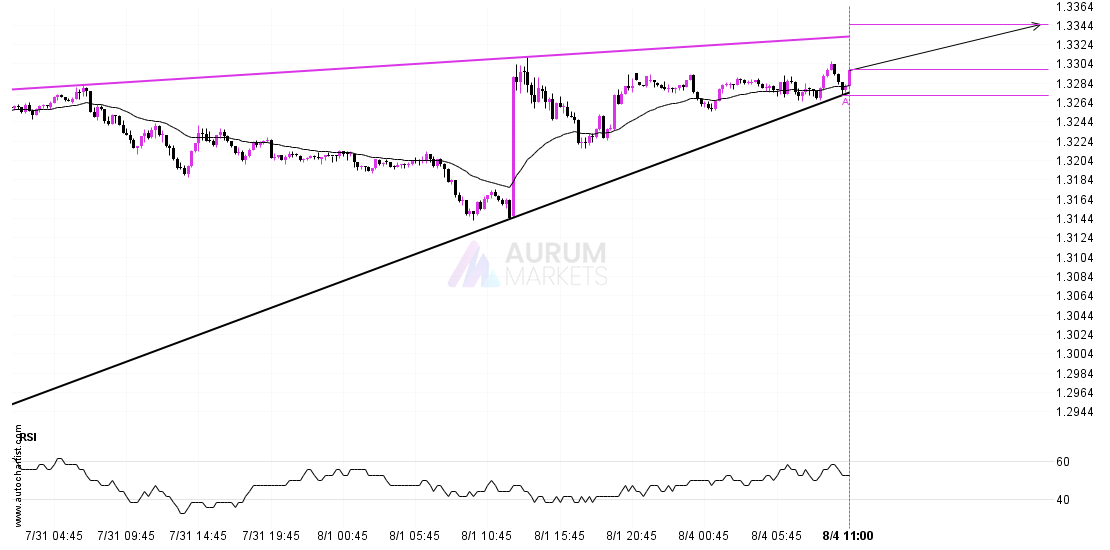
GBPUSD is heading towards the resistance line of a Rising Wedge. If this movement continues, the price of GBPUSD could test 1.3344 within the next 17 hours. It has tested
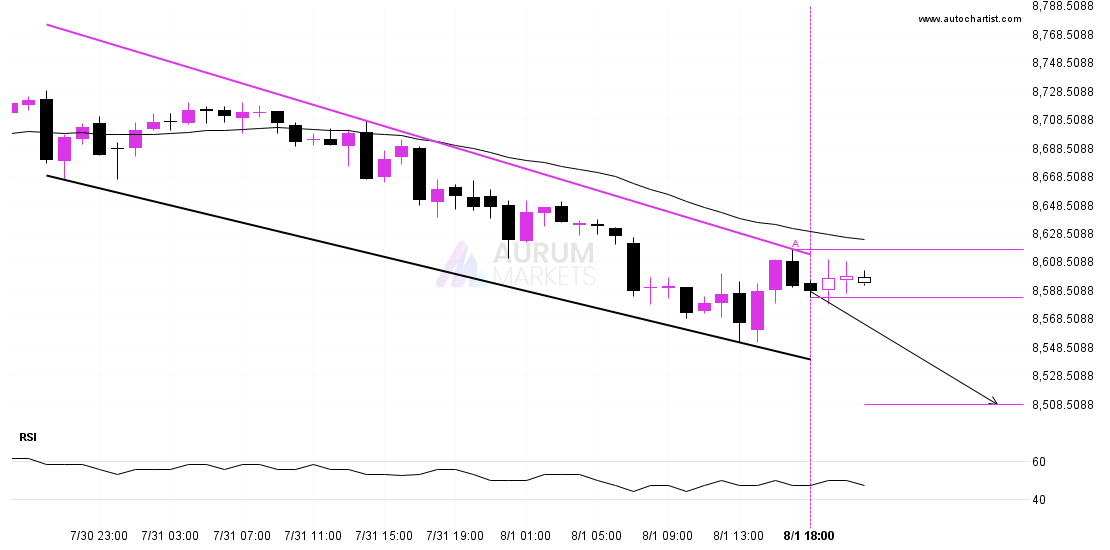
ASX 225 is moving towards a support line. Because we have seen it retrace from this line before, we could see either a break through this line, or a rebound
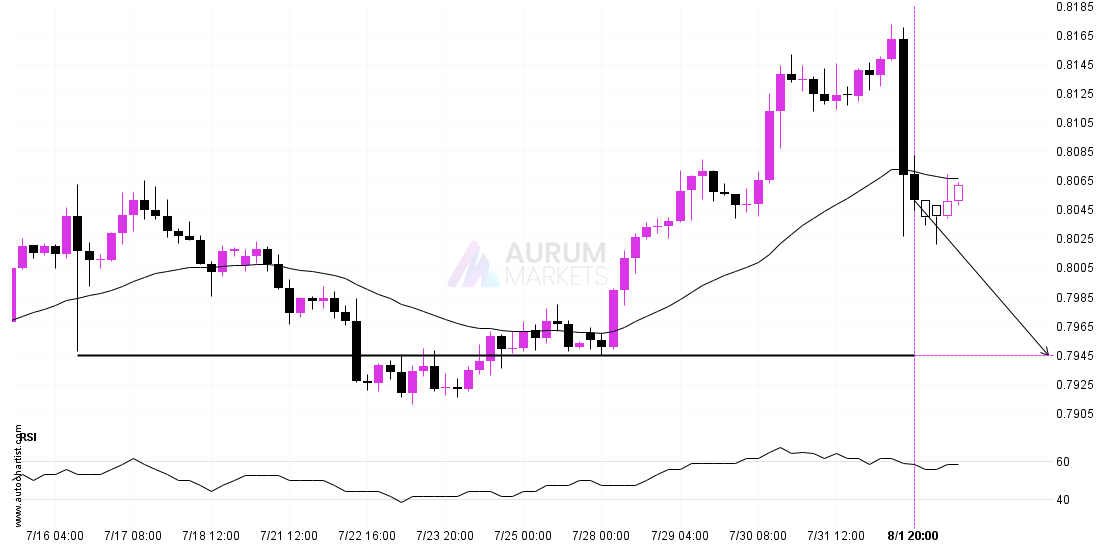
The price of USDCHF in heading back to the support area. It is possible that it will struggle to break through it and move back in the other direction. The
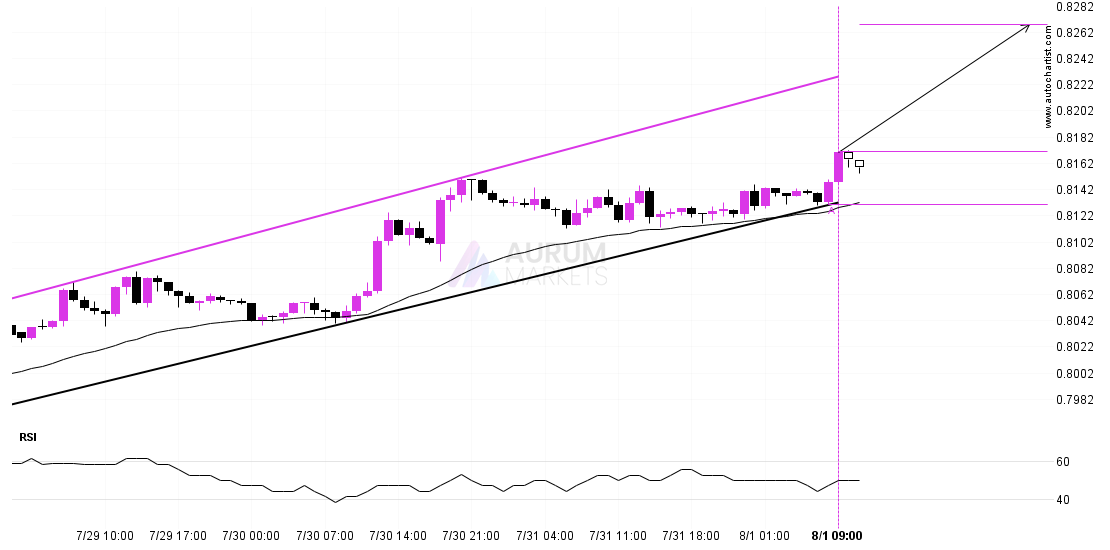
USDCHF was identified at around 0.817115 having recently rebounded of the support on the 1 hour data interval. Ultimately, the price action of the stock has formed a Channel Up
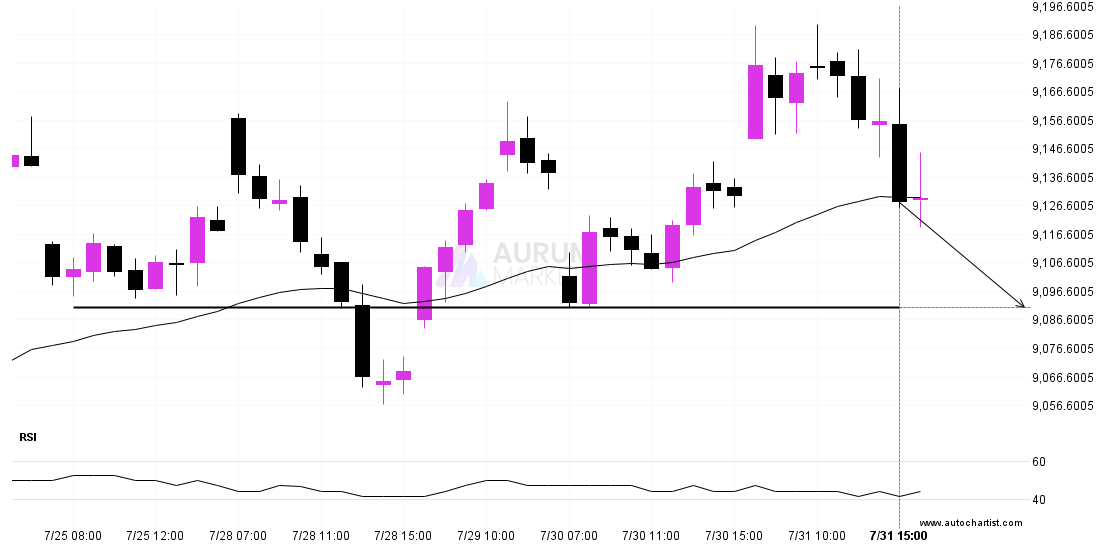
FTSE 100 is approaching a support line at 9090.7998. If it hits the support line, it may break through this level to continue the bearish trend, or it may turn