A potential bullish movement on ASX 225A potential bullish movement on ASX 225
A strong resistance level has been identified at 7951.2002 on the 1 hour ASX 225 chart. ASX 225 is likely to test it soon. Supported by Upward sloping Moving Average


A strong resistance level has been identified at 7951.2002 on the 1 hour ASX 225 chart. ASX 225 is likely to test it soon. Supported by Upward sloping Moving Average
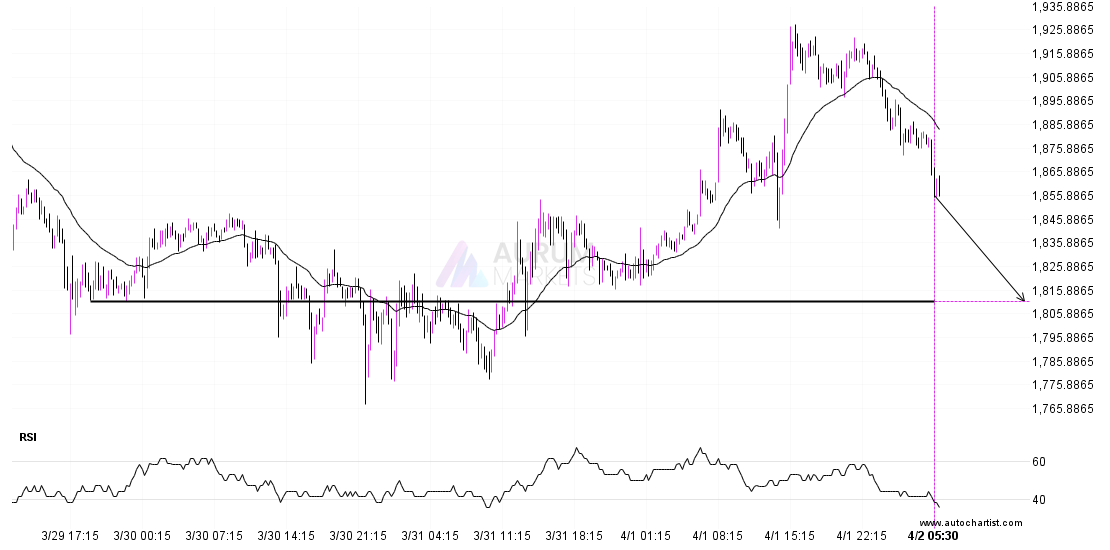
ETHUSD is moving towards a line of 1811.0699 which it has tested numerous times in the past. We have seen it retrace from this position in the past, so at

USDCHF is heading towards the resistance line of a Ascending Triangle and could reach this point within the next 2 days. It has tested this line numerous times in the
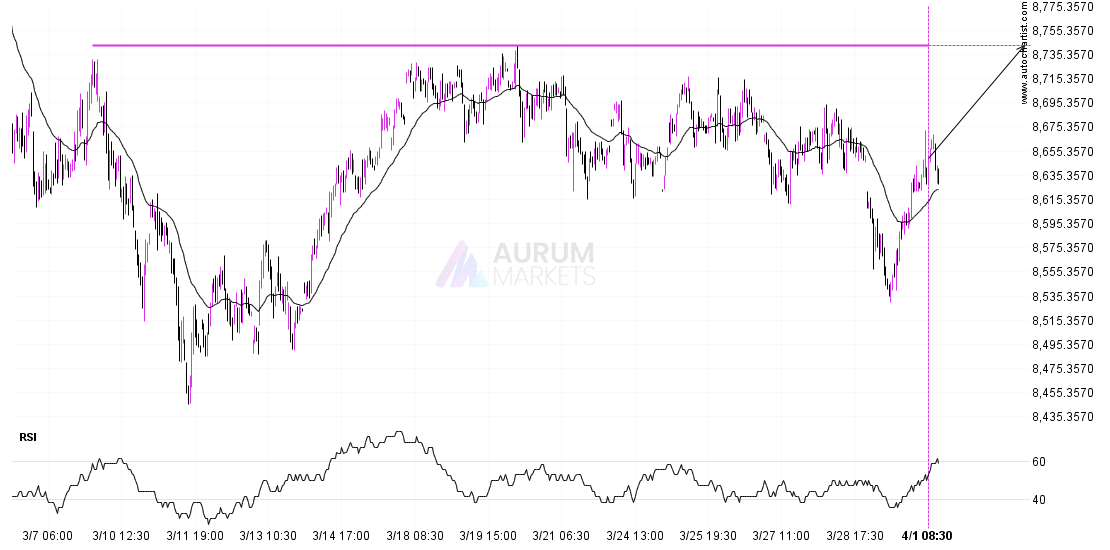
FTSE 100 is moving towards a line of 8742.5000 which it has tested numerous times in the past. We have seen it retrace from this position in the past, so
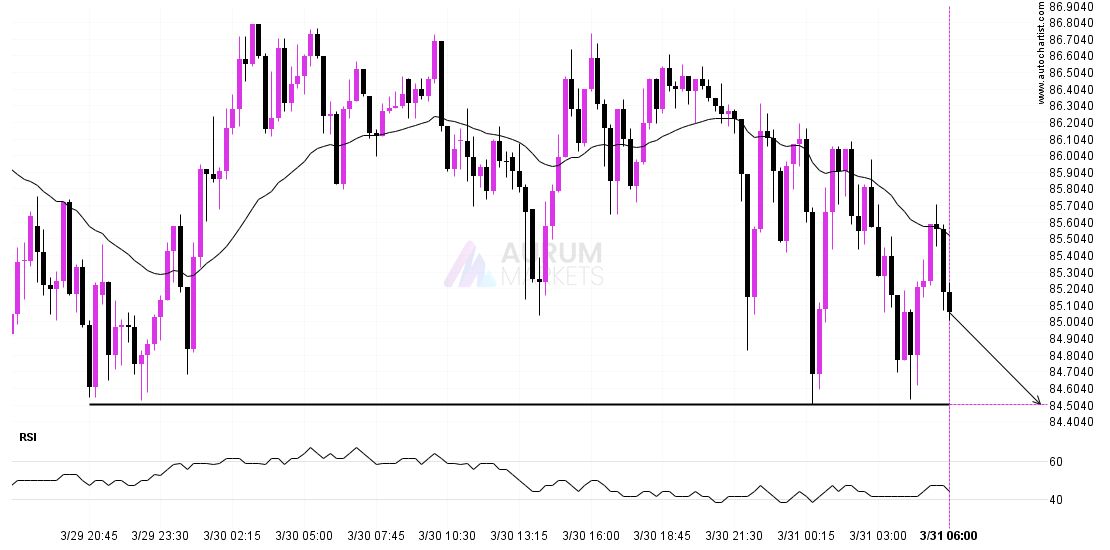
A strong support level has been identified at 84.5100 on the 15 Minutes LTCUSD chart. LTCUSD is likely to test it soon. Supported by Downward sloping Moving Average Target: 84.51
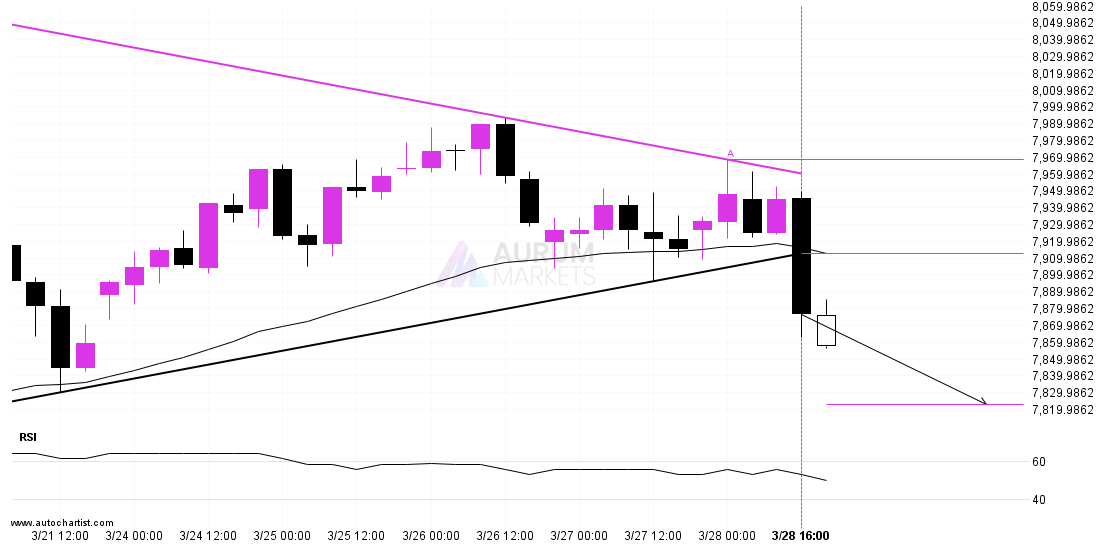
This trade setup on ASX 225 is formed by a period of consolidation; a period in which the price primarily moves sideways before choosing a new direction for the longer
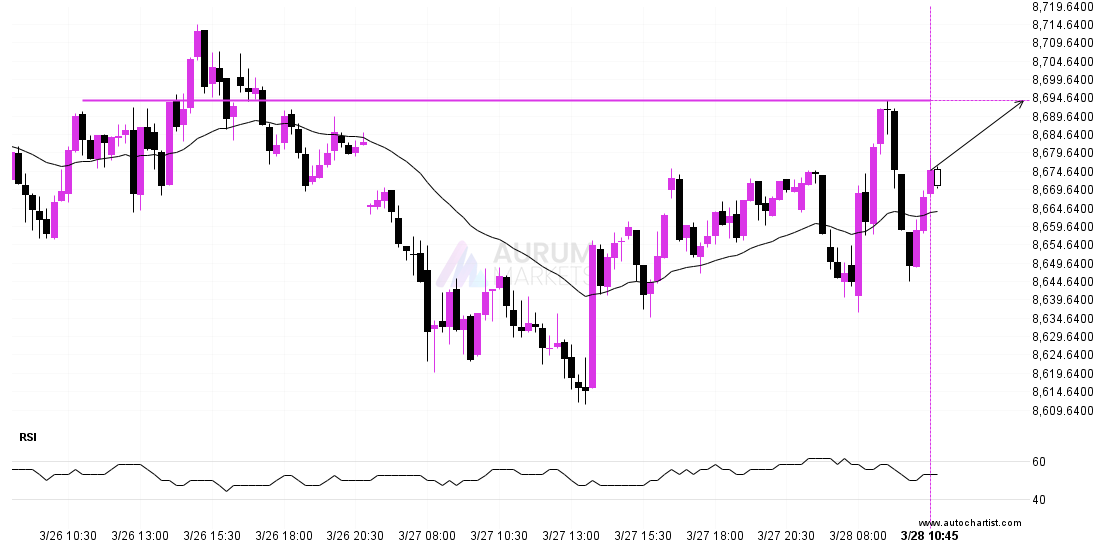
FTSE 100 is heading towards 8693.8496 and could reach this point within the next 7 hours. It has tested this line numerous times in the past, and this time could
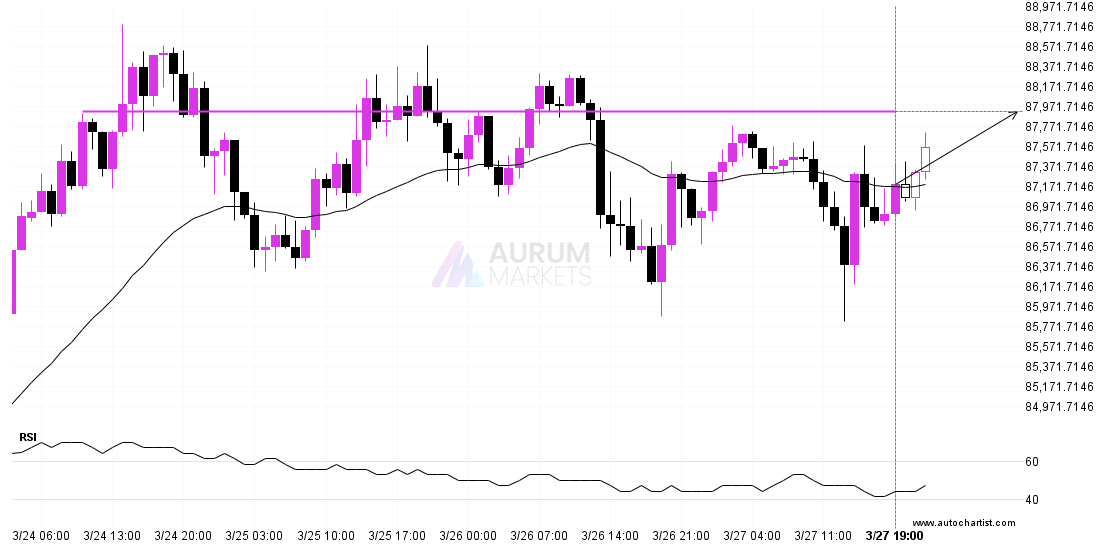
BTCUSD is moving towards a key resistance level at 87922.6094. BTCUSD has previously tested this level 3 times and on each occasion it has bounced back off this level. Is
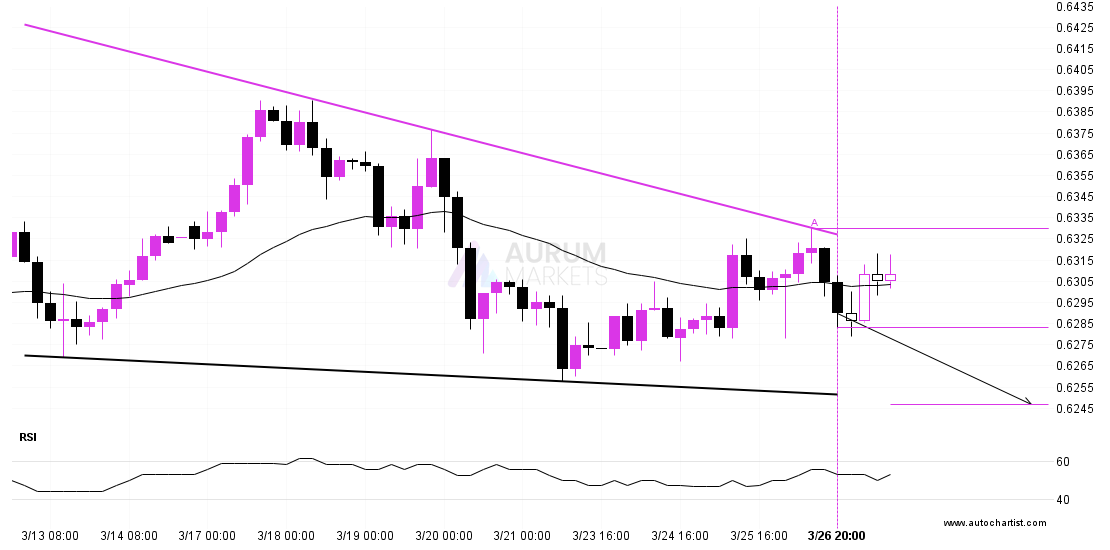
AUDUSD is moving towards a support line which it has tested numerous times in the past. We have seen it retrace from this line before, so at this stage it
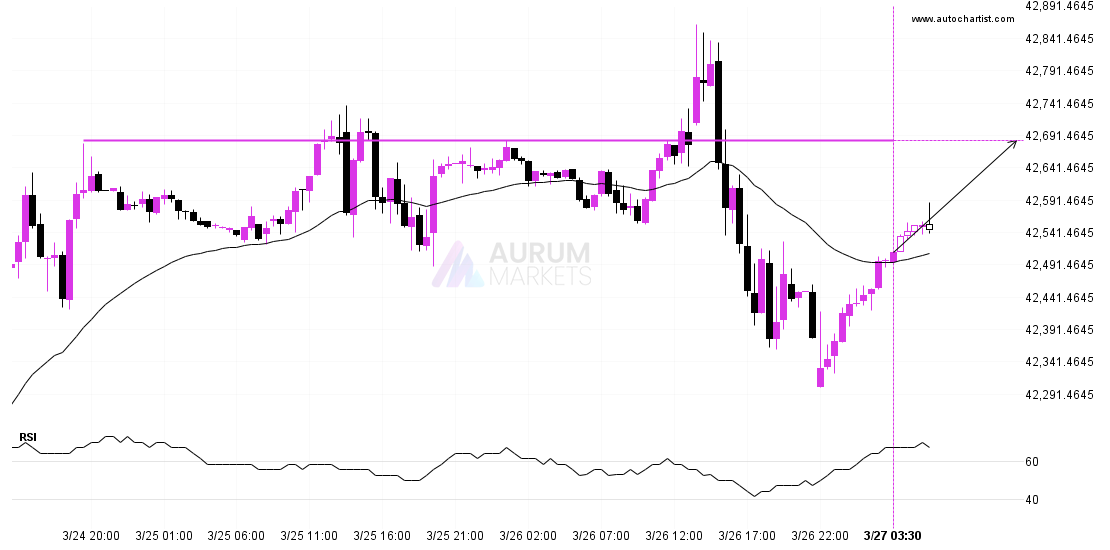
DOW 30 is heading towards a line of 42684.3281. If this movement continues, the price of DOW 30 could test 42684.3281 within the next 11 hours. But don’t be so