Aurum Markets Blog Technical Analysis bullish technical pattern on FTSE 100 15 Minutes

bullish technical pattern on FTSE 100 15 Minutes

bullish technical pattern on FTSE 100 15 Minutes post thumbnail image

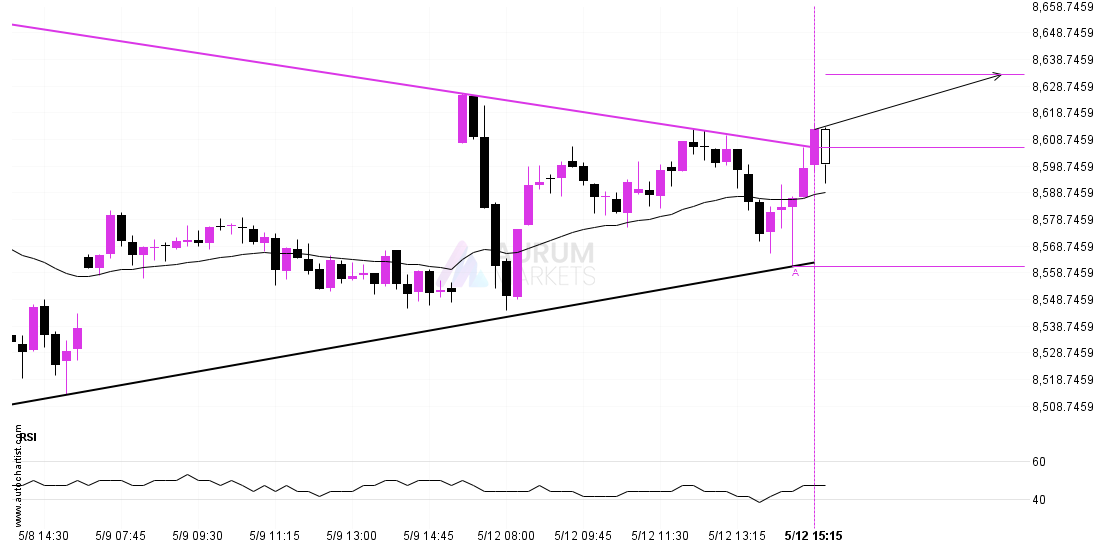
The last 5 15 Minutes candles on FTSE 100 formed a Triangle pattern and broken out through the pattern lines, indicating a possible bullish movement towards the price level of 8633.2325.

Supported by Upward sloping Moving Average

Target: 8633.2325 Entry: 8605.8586 Stop: 8561.18

Leave a Reply

Your email address will not be published. Required fields are marked *

Related Post