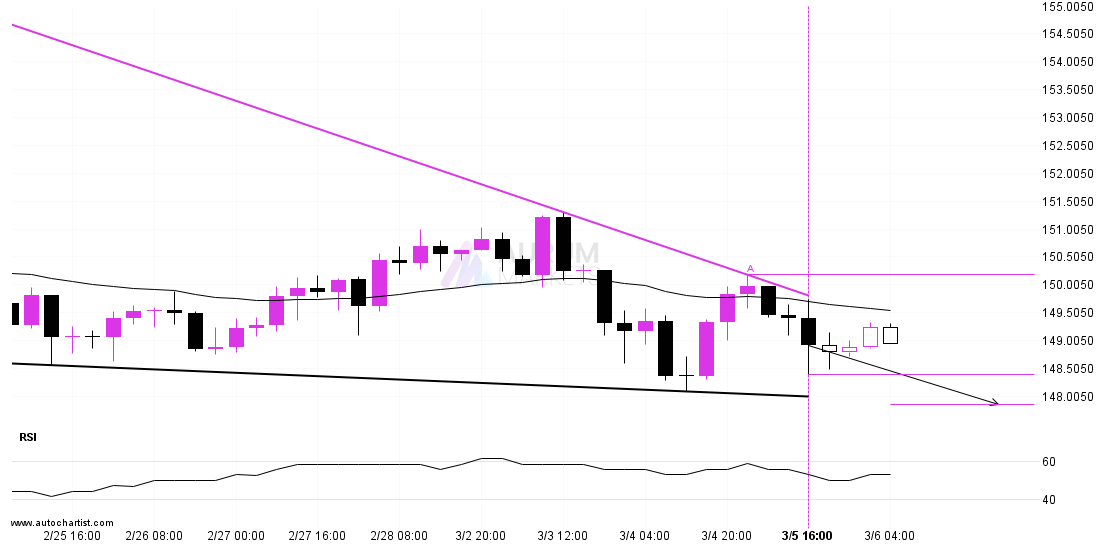
Emerging Falling Wedge pattern in its final wave was identified on the USDJPY 4 hour chart. After a strong bearish run, we find USDJPY heading towards the upper triangle line with a possible resistance at 147.8653. If the support shows to hold, the Falling Wedge pattern suggests a rebound back towards current levels.
Supported by Downward sloping Moving Average
Target: 147.8653 Entry: 148.398 Stop: 150.185