ABCD Fibonacci pattern identified at 12/4 00:00. This pattern is still in the process of forming. Possible bullish price movement towards target levels ranging from 9,445.19 to 10,045.43 within the next 2 days.
Target: 8473.99 Entry: Stop: 9259.71


ABCD Fibonacci pattern identified at 12/4 00:00. This pattern is still in the process of forming. Possible bullish price movement towards target levels ranging from 9,445.19 to 10,045.43 within the next 2 days.
Target: 8473.99 Entry: Stop: 9259.71
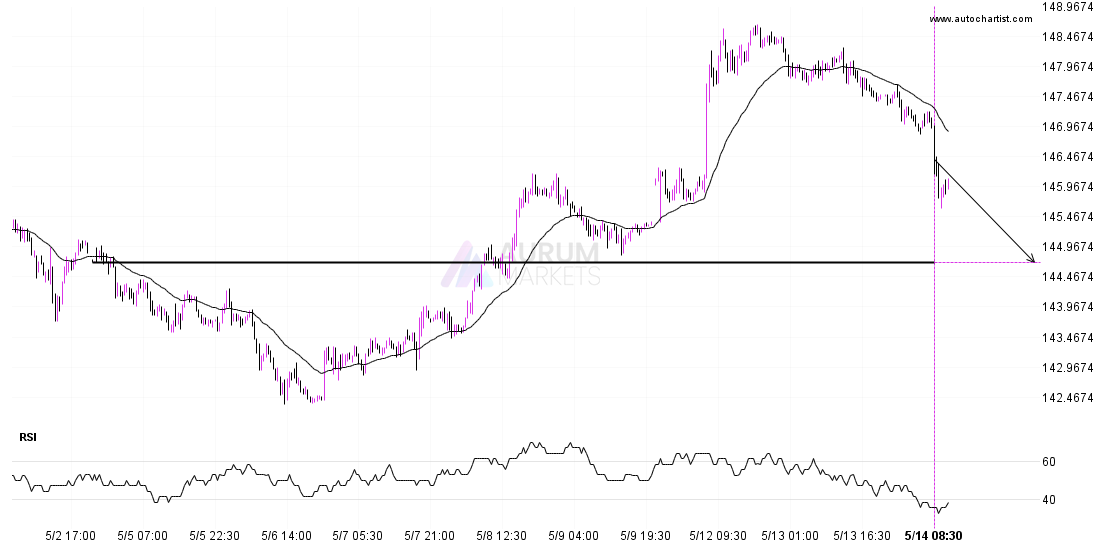
USDJPY is moving towards a key support level at 144.7020. USDJPY has previously tested this level 3 times and on each occasion it has bounced back off this level. Is

Approaching Support level of 96.31 identified at 9/9 10:00. This pattern is still in the process of forming. Possible bearish price movement towards the support 96.31 within the next 4
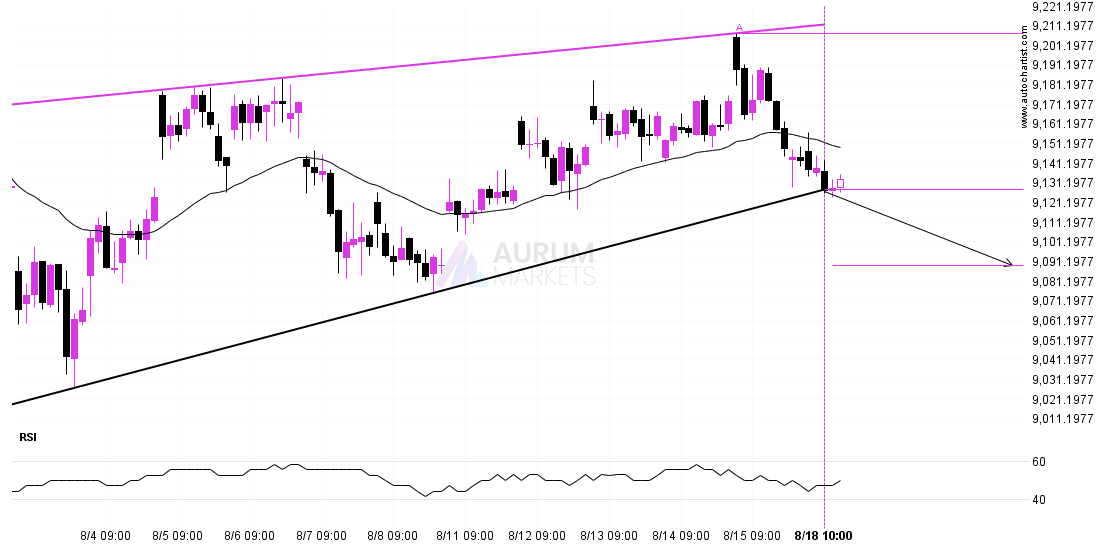
Rising Wedge pattern identified on FTSE 100 has broken through a support level with the price momentum continuing to move in an downward direction. A solid trading opportunity continues with