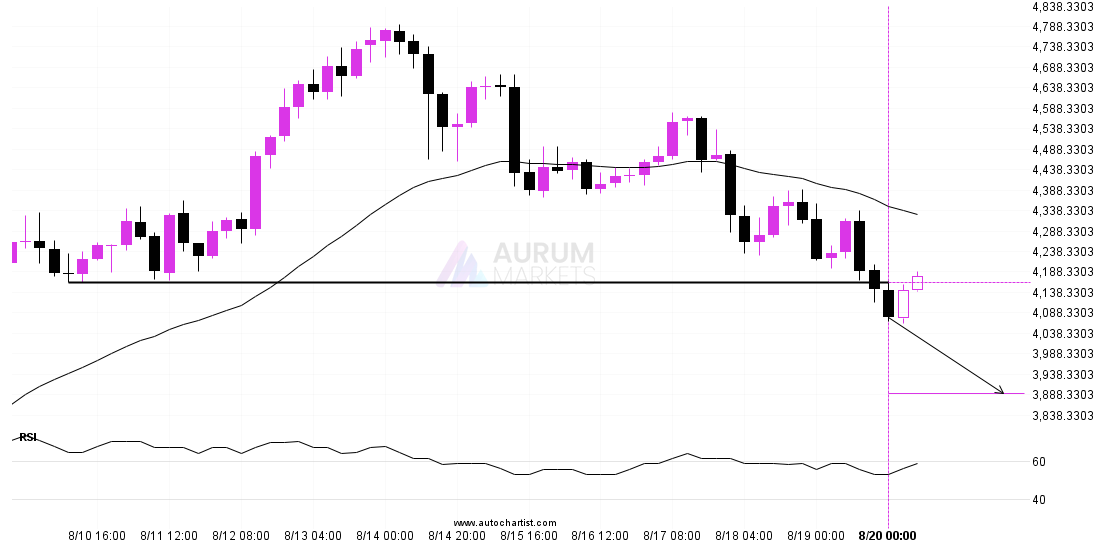
ETHUSD – psychological price line breachedETHUSD – psychological price line breached
ETHUSD has broken through 4161.6099 which it has tested numerous times in the past. We have seen it retrace from this price in the past. If this new trend persists,

ETHUSD has broken through 4161.6099 which it has tested numerous times in the past. We have seen it retrace from this price in the past. If this new trend persists,
ASX 225 is moving towards a support line which it has tested numerous times in the past. We have seen it retrace from this line before, so at this stage
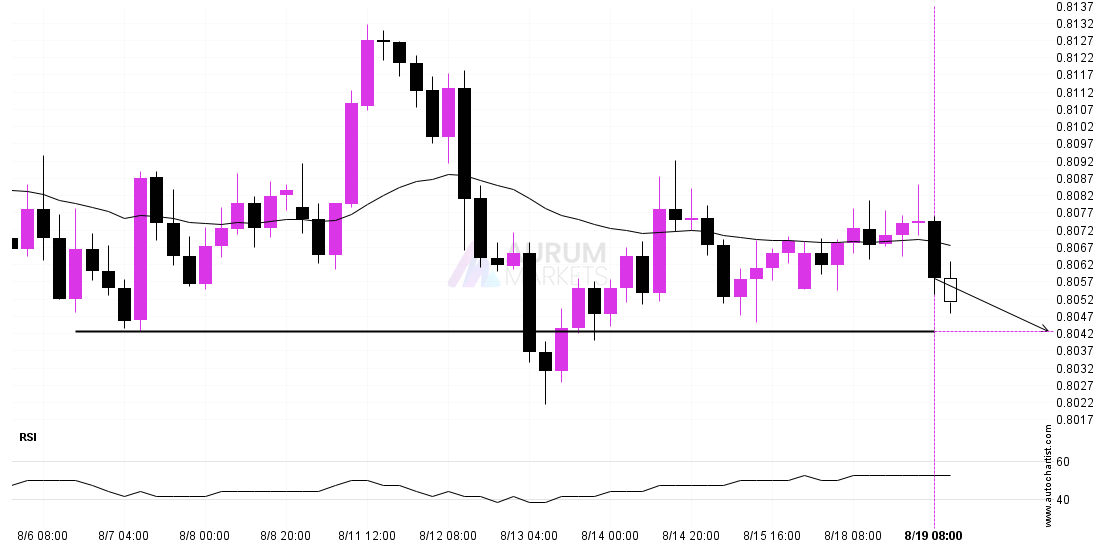
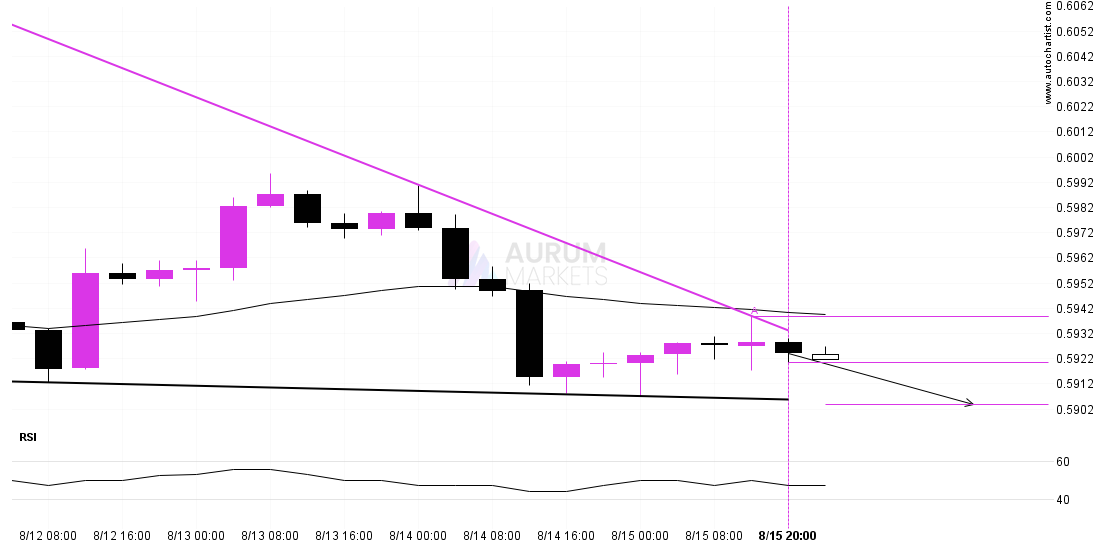
A strong support level has been identified at 0.8043 on the 4 hour USDCHF chart. USDCHF is likely to test it soon. Supported by Downward sloping Moving Average Target: 0.8043
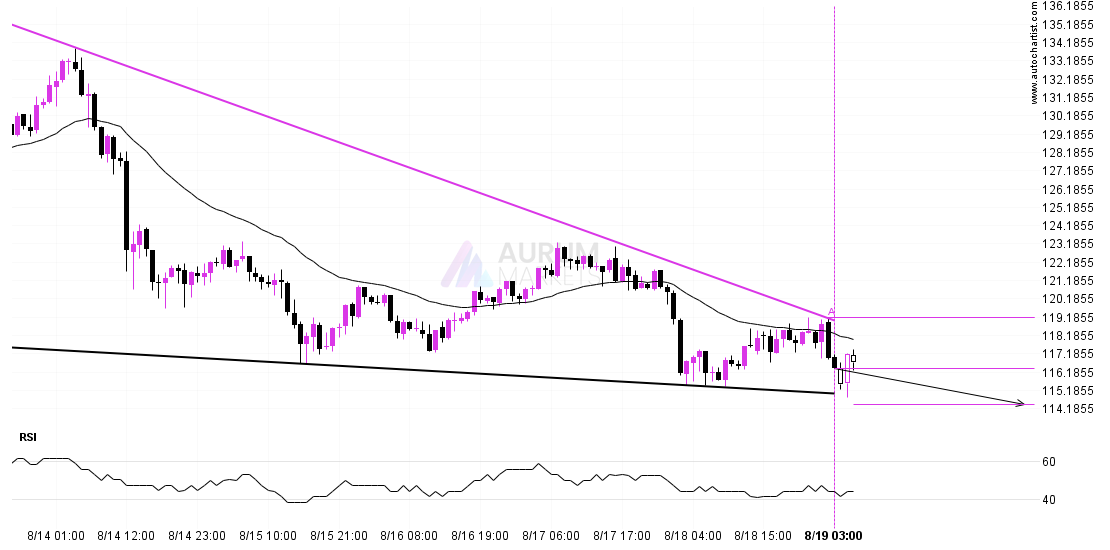
An emerging Falling Wedge has been detected on LTCUSD on the 1 hour chart. There is a possible move towards 114.4363 next few candles. Once reaching resistance it may continue
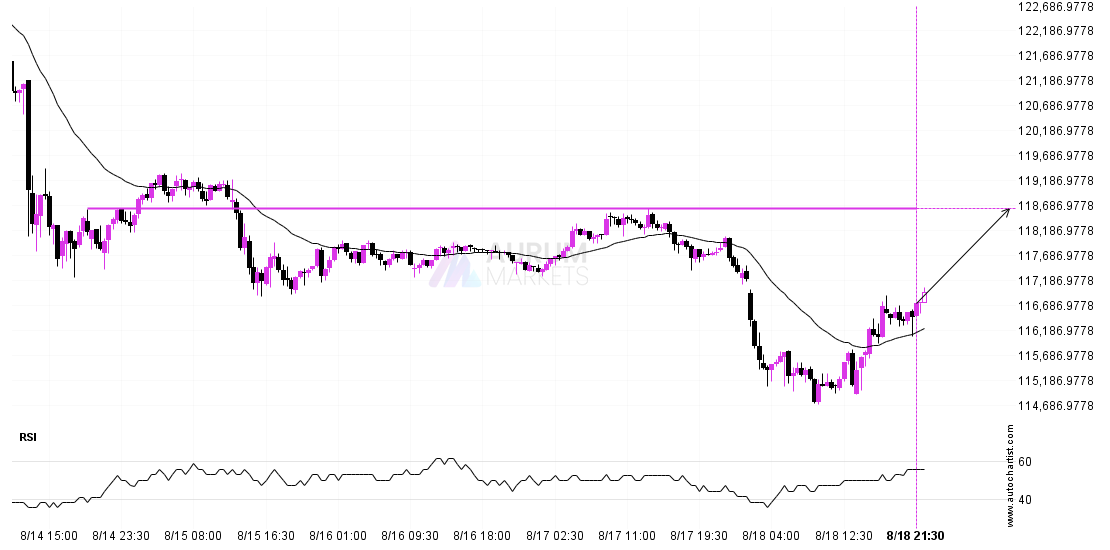
BTCUSD is approaching a resistance line at 118639.8125. If it hits the resistance line, it may break through this level to continue the bullish trend, or it may turn around
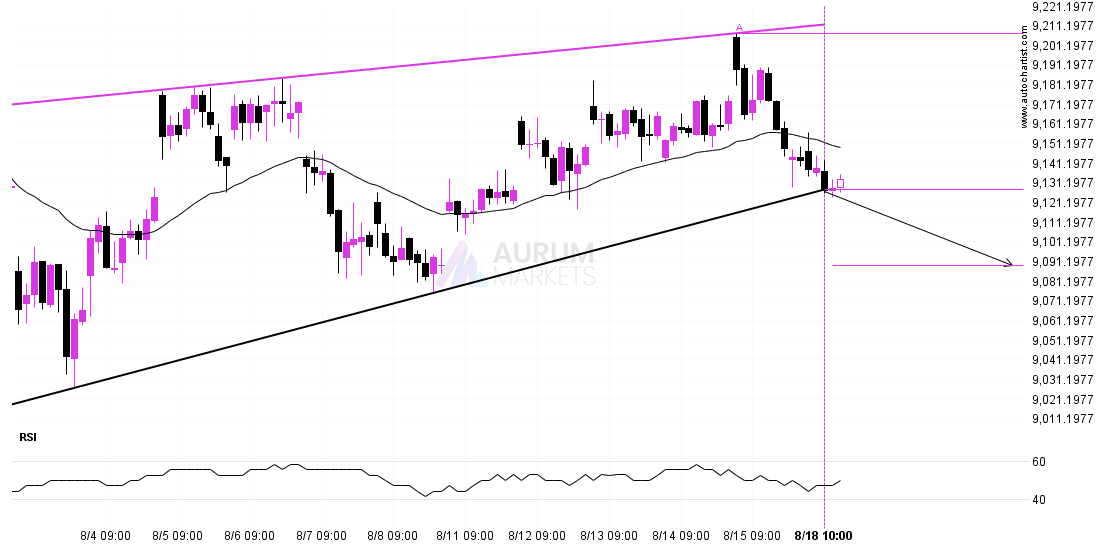
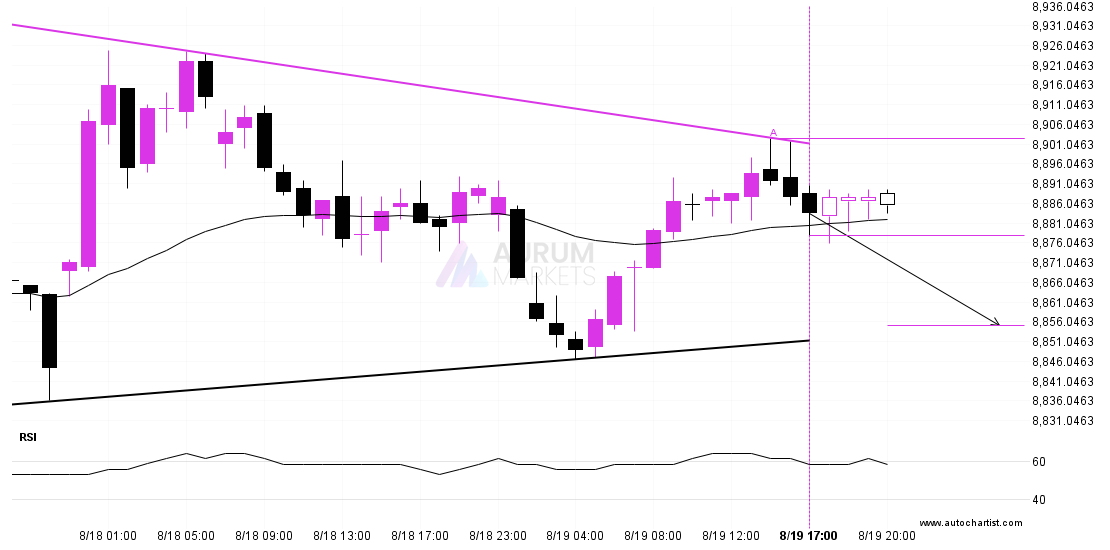
Rising Wedge pattern identified on FTSE 100 has broken through a support level with the price momentum continuing to move in an downward direction. A solid trading opportunity continues with
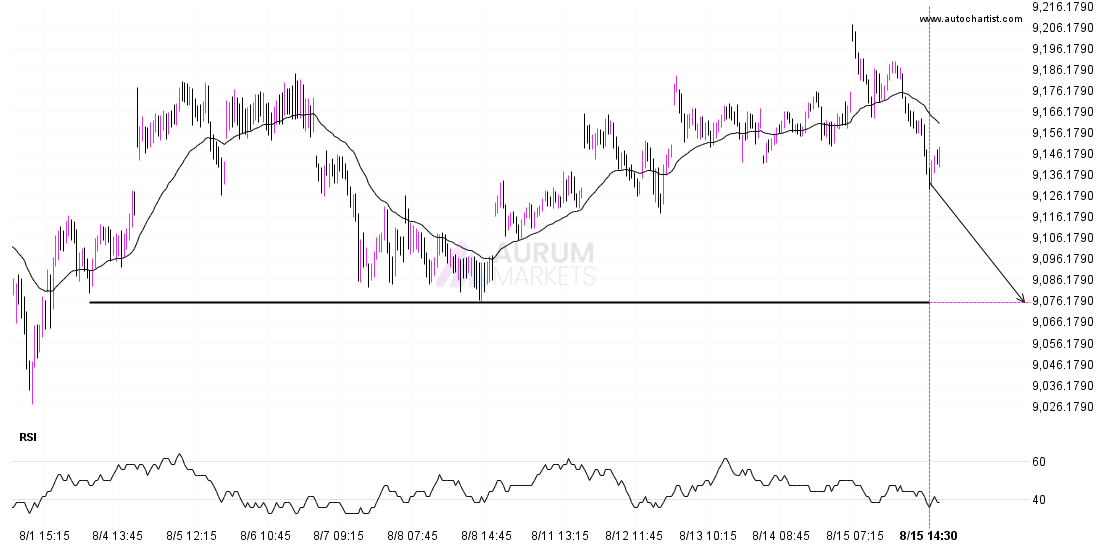
FTSE 100 is heading towards 9075.2998 and could reach this point within the next 18 hours. It has tested this line numerous times in the past, and this time could
NZDUSD is moving towards a support line which it has tested numerous times in the past. We have seen it retrace from this line before, so at this stage it
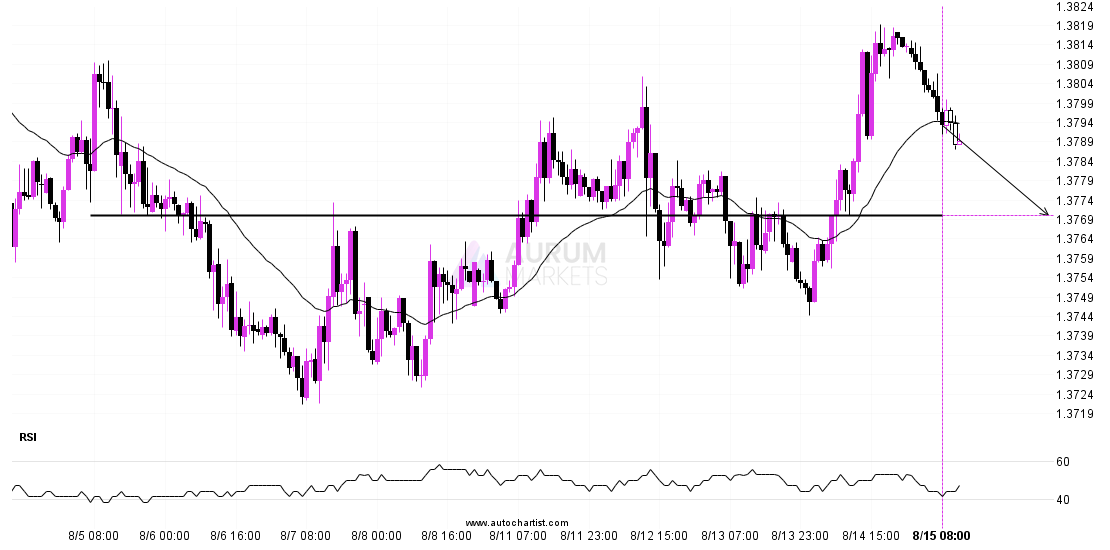
USDCAD is heading towards 1.3771 and could reach this point within the next 2 days. It has tested this line numerous times in the past, and this time could be
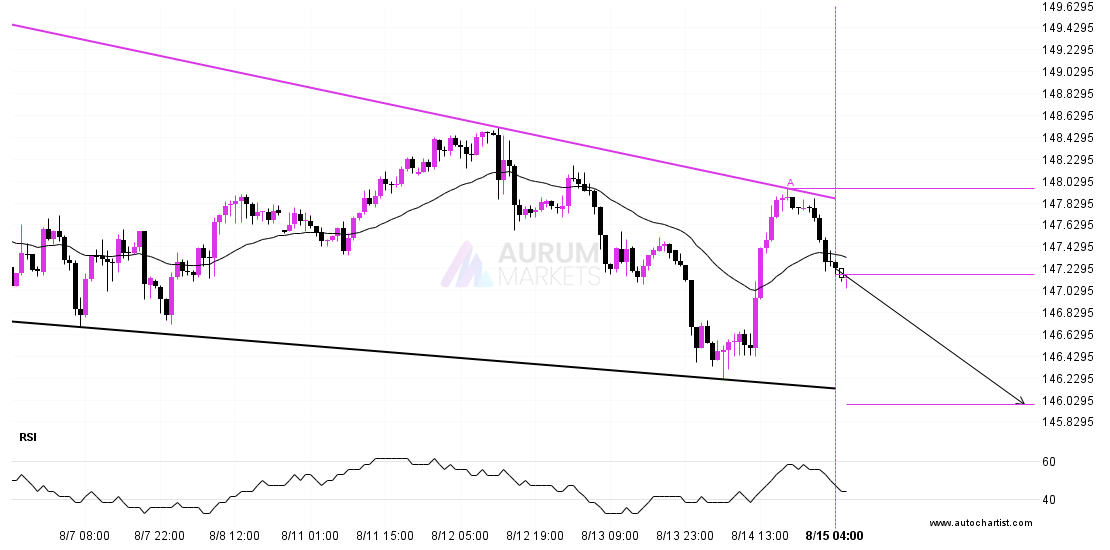
Emerging Falling Wedge pattern in its final wave was identified on the USDJPY 1 hour chart. After a strong bearish run, we find USDJPY heading towards the upper triangle line