Resistance line breached by AUDUSDResistance line breached by AUDUSD
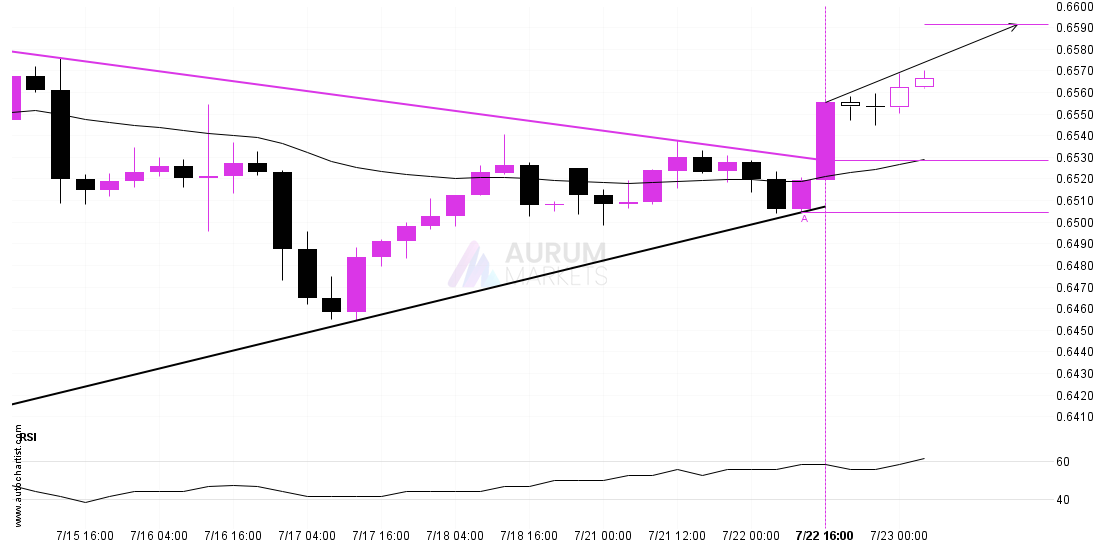
The last 14 4 hour candles on AUDUSD formed a Triangle pattern and broken out through the pattern lines, indicating a possible bullish movement towards the price level of 0.6591.

The last 14 4 hour candles on AUDUSD formed a Triangle pattern and broken out through the pattern lines, indicating a possible bullish movement towards the price level of 0.6591.
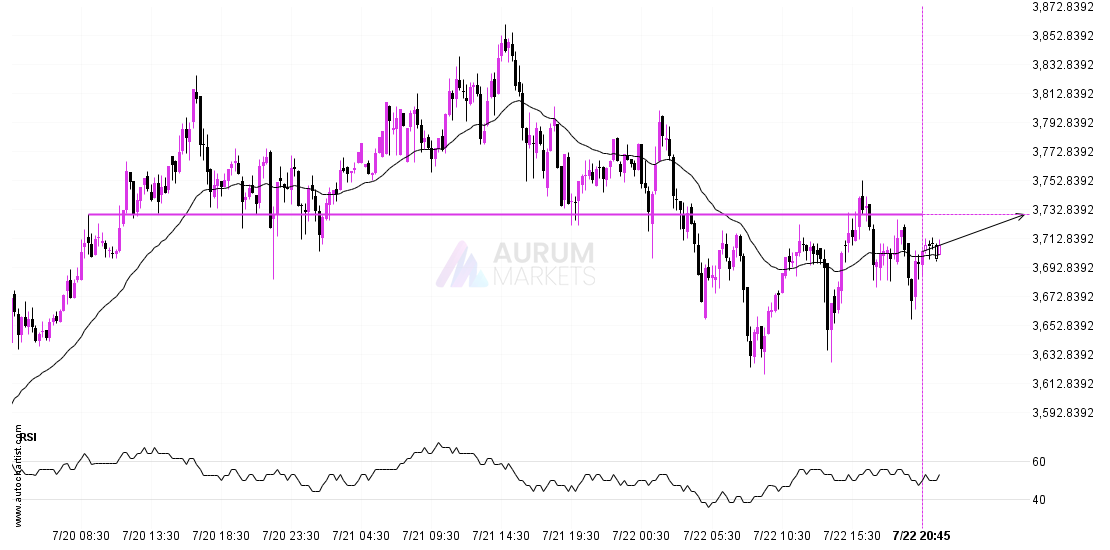
The price of ETHUSD in heading back to the resistance area. It is possible that it will struggle to break through it and move back in the other direction. The
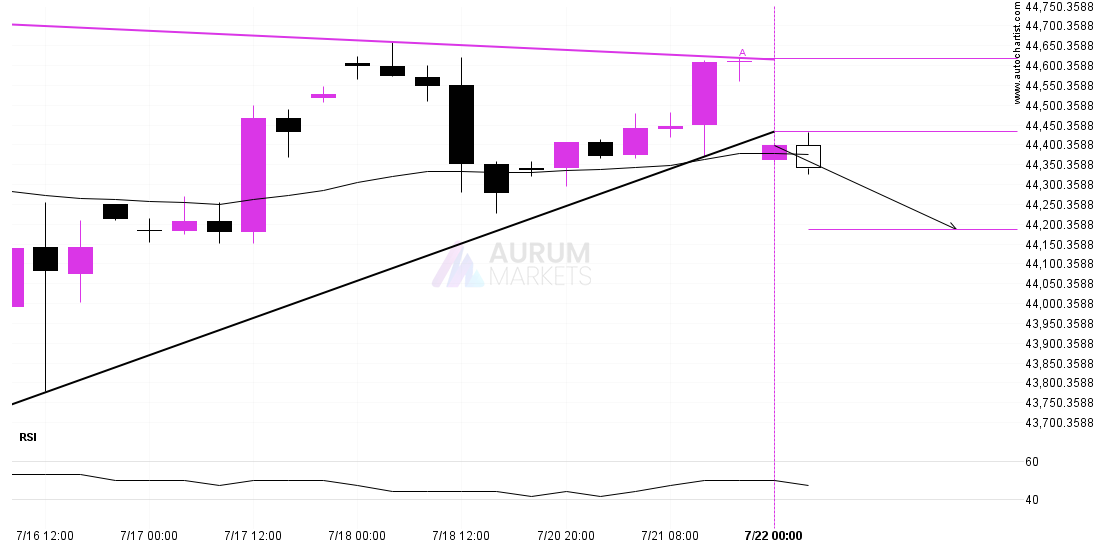
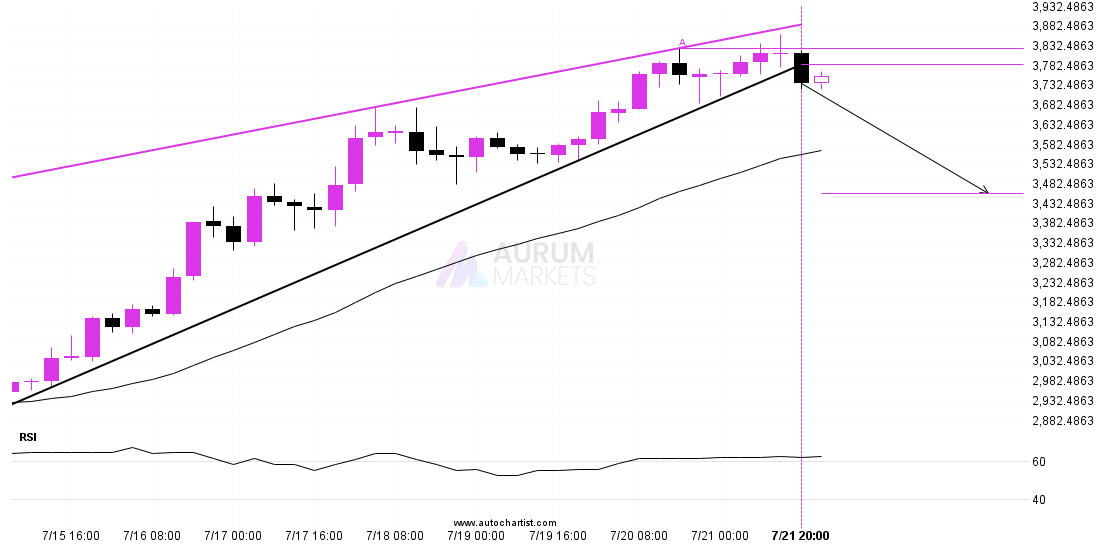
The breakout of DOW 30 through the support line of a Triangle could be a sign of the road ahead. If this breakout persists, we may see the price of
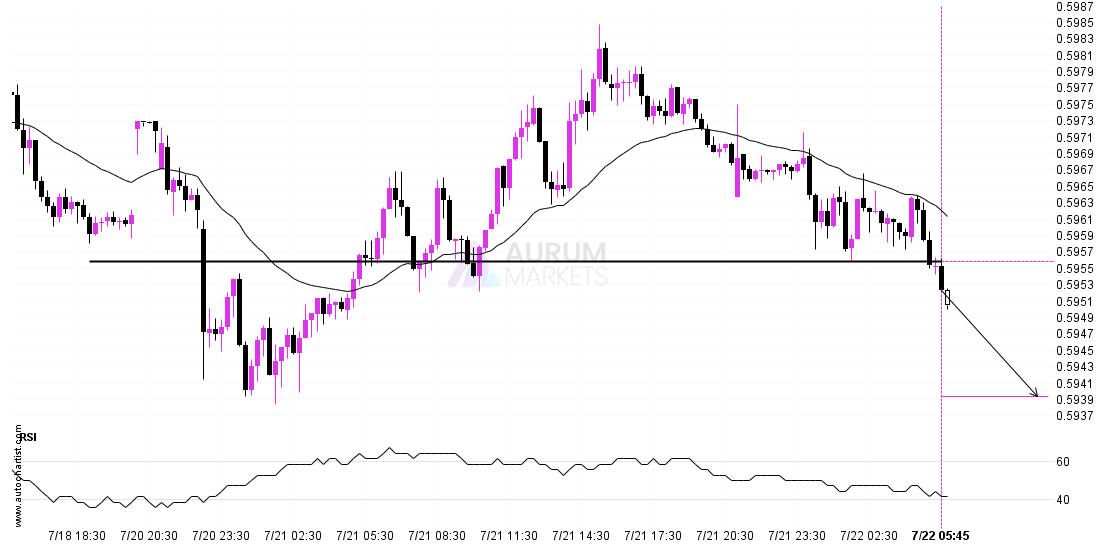
NZDUSD has broken through 0.5956 which it has tested numerous times in the past. We have seen it retrace from this price in the past. If this new trend persists,
You would be well advised to confirm the breakout that has just occurred – do you believe the move through support to be significant? Do you have confirming indicators that
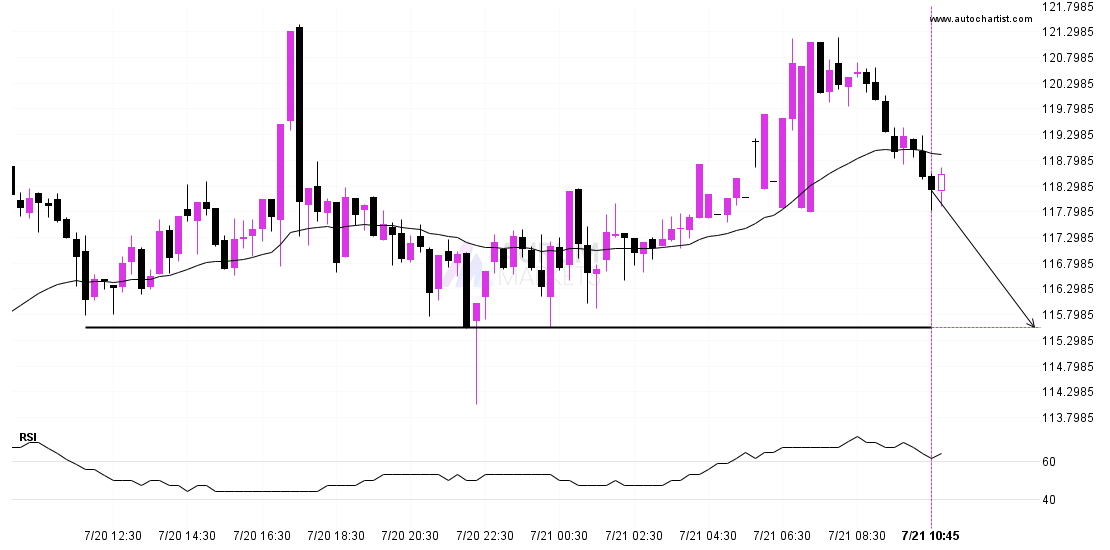
A strong support level has been identified at 115.5400 on the 15 Minutes LTCUSD chart. LTCUSD is likely to test it soon. Supported by RSI above 60 Target: 115.54 Entry:
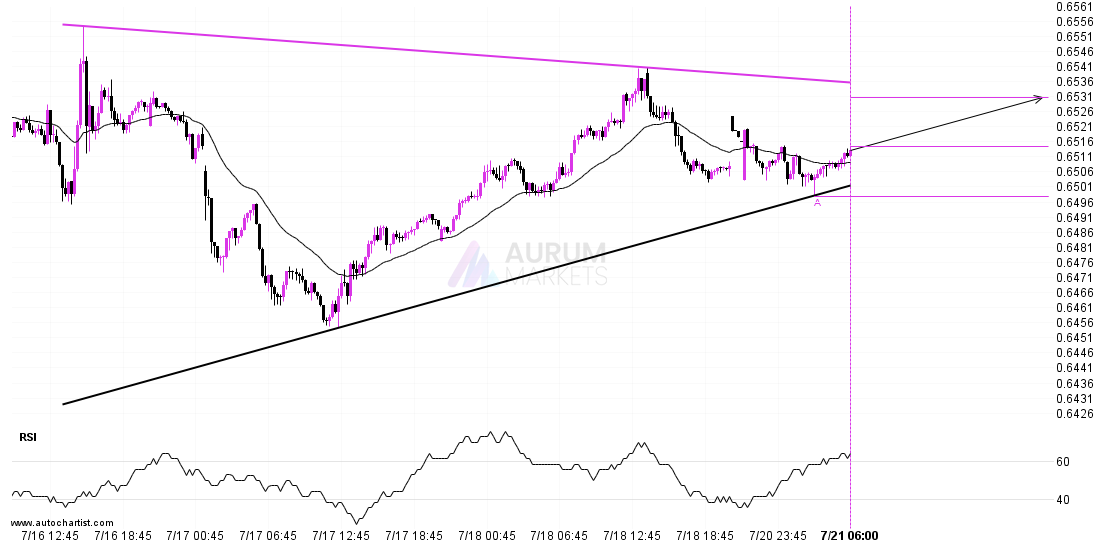
An emerging Triangle has been detected on AUDUSD on the 15 Minutes chart. There is a possible move towards 0.6531 next few candles. Once reaching support it may continue its
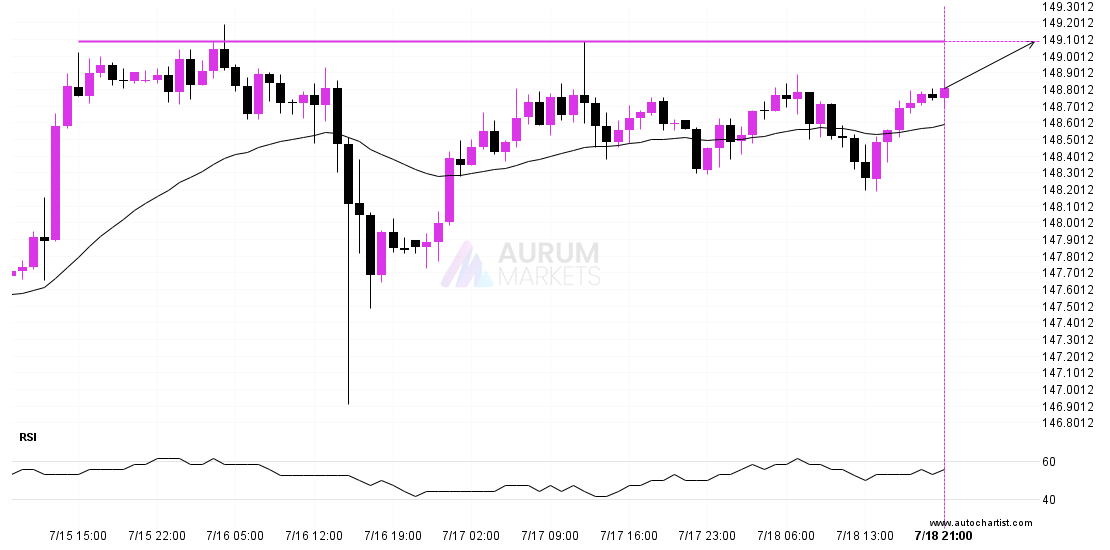
The movement of USDJPY towards 149.0890 price line is yet another test of the line it reached numerous times in the past. We could expect this test to happen in
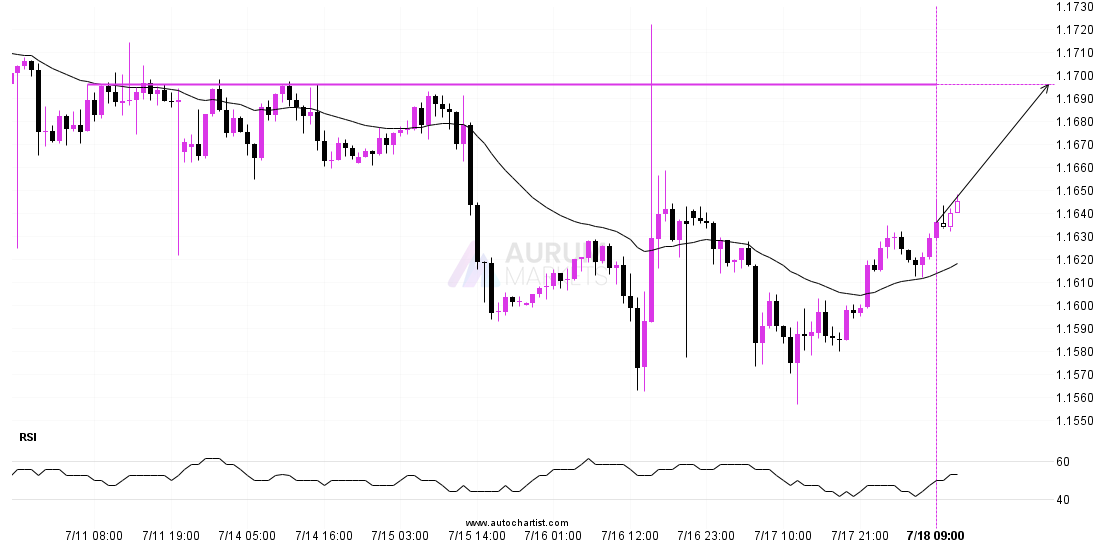
EURUSD is approaching a resistance line at 1.1696. If it hits the resistance line, it may break through this level to continue the bullish trend, or it may turn around
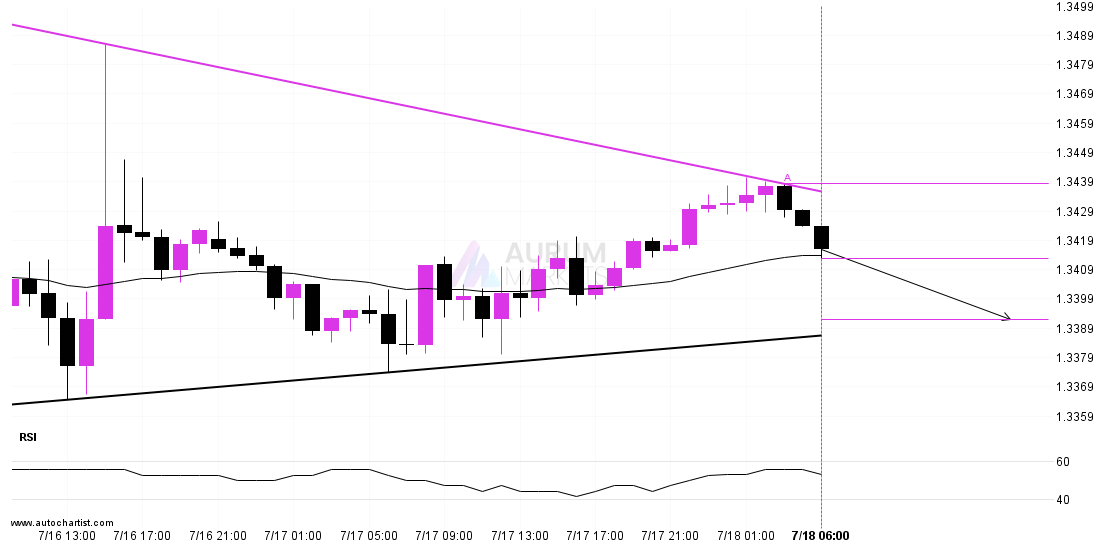
GBPUSD is heading towards the support line of a Triangle and could reach this point within the next 12 hours. It has tested this line numerous times in the past,