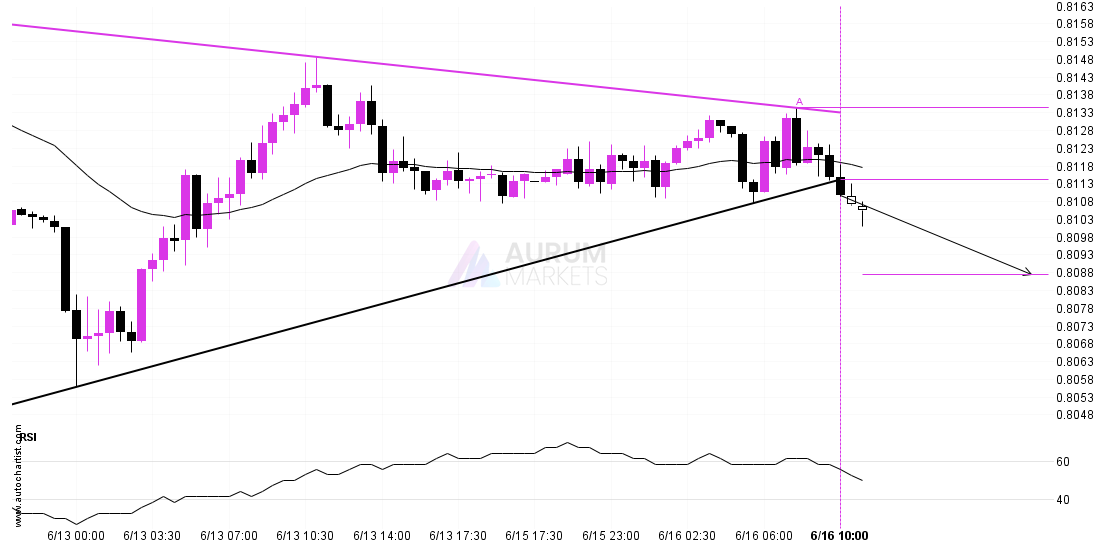
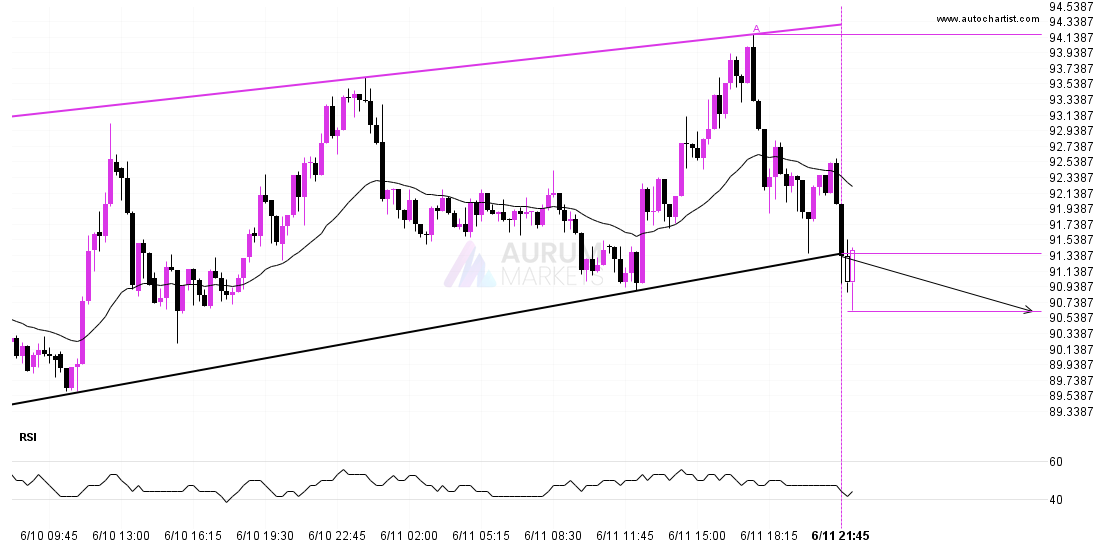
Triangle breakout on USDCHFTriangle breakout on USDCHF
You would be well advised to confirm the breakout that has just occurred – do you believe the move through support to be significant? Do you have confirming indicators that

You would be well advised to confirm the breakout that has just occurred – do you believe the move through support to be significant? Do you have confirming indicators that
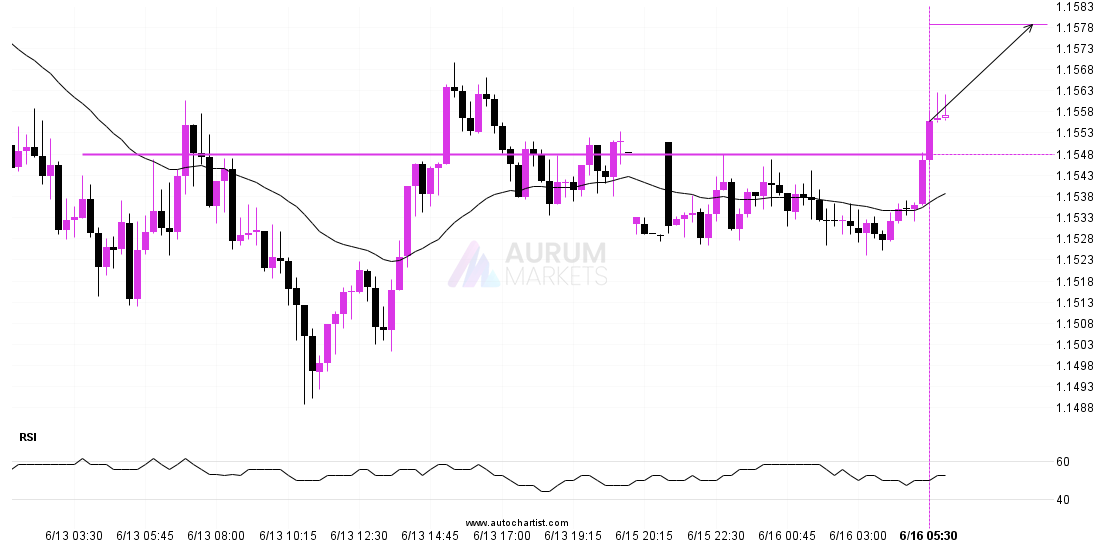
EURUSD is once again retesting a key horizontal resistance level at 1.1548. It has tested this level 6 times in the recent past and could simply bounce off like it
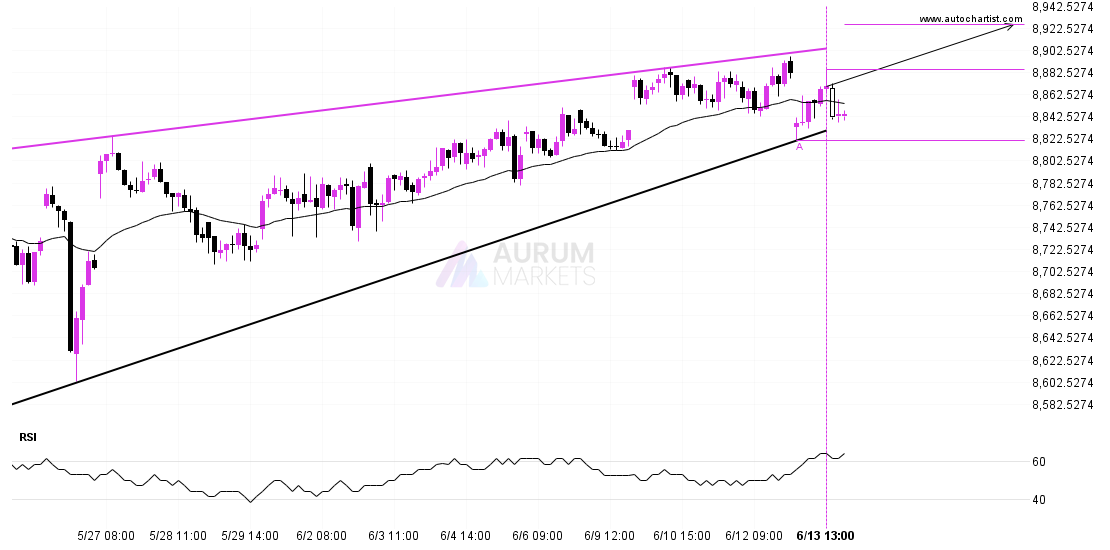
A Rising Wedge pattern was identified on FTSE 100 at 8884.8, creating an expectation that it may move to the resistance line at 8925.3945. It may break through that line
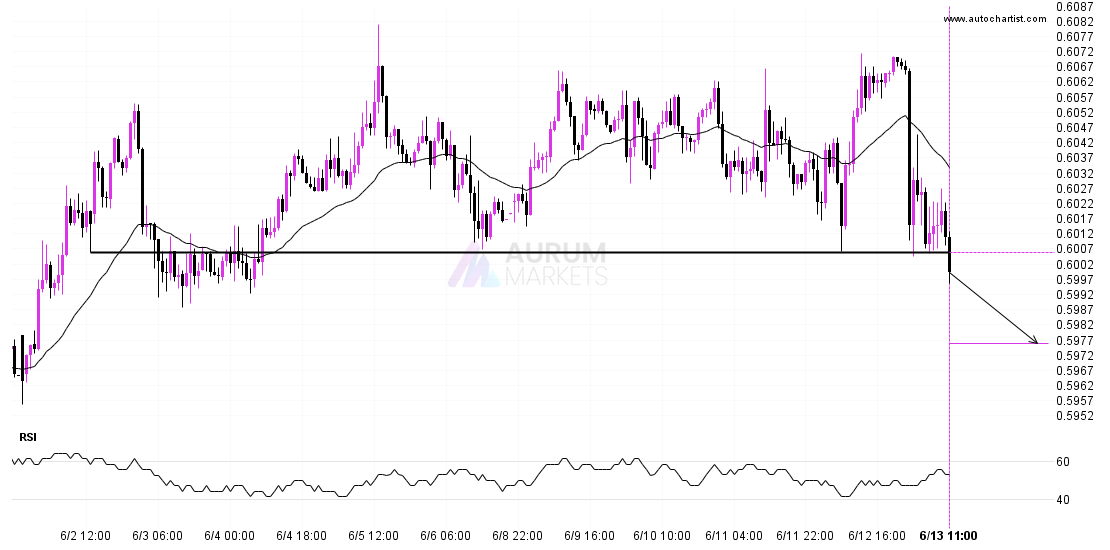
The breakout of NZDUSD through the 0.6005 price line is a breach of an important psychological price that is has tested numerous in the past. If this breakout persists, NZDUSD
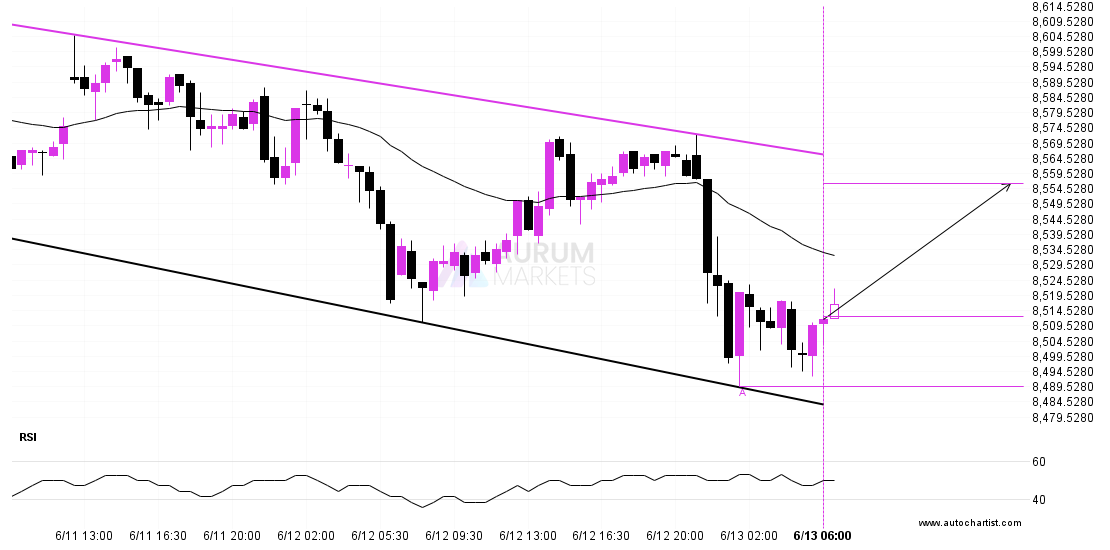
Emerging Channel Down detected on ASX 225 – the pattern is an emerging one and has not yet broken through support, but the price is expected to move up over
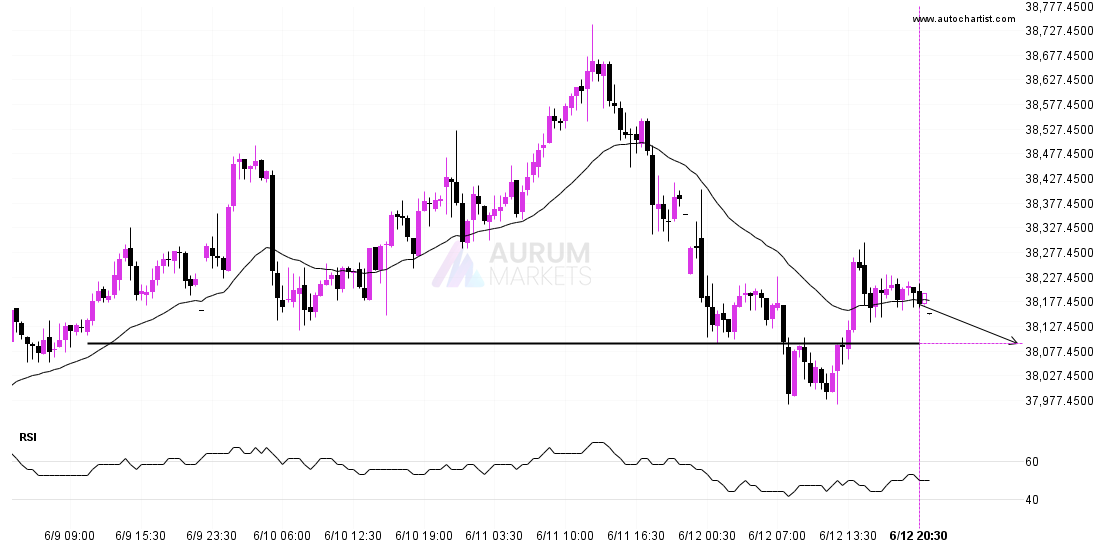
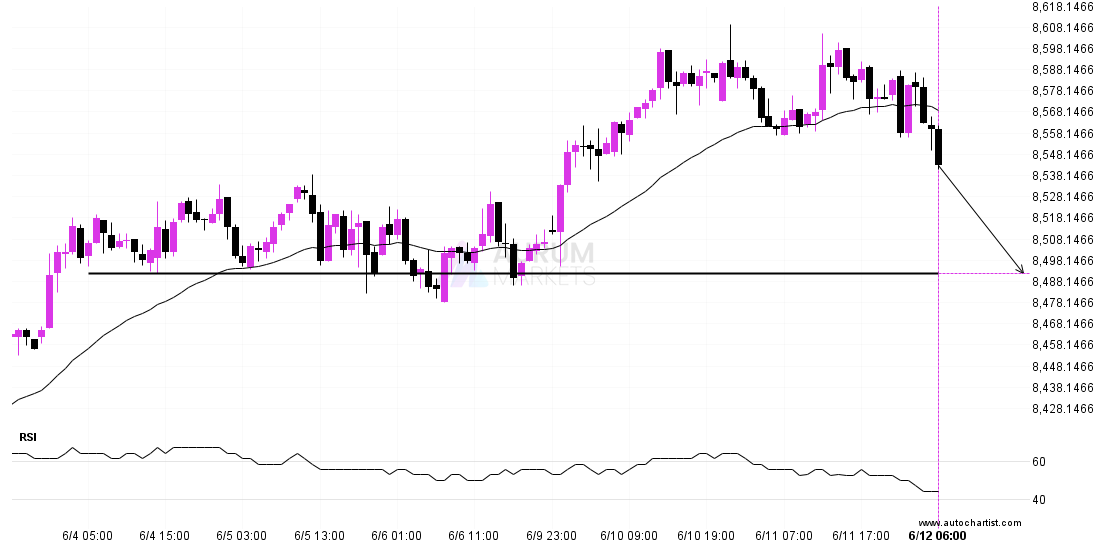
Nikkei 225 is heading towards a line of 38093.0000. If this movement continues, the price of Nikkei 225 could test 38093.0000 within the next 18 hours. But don’t be so
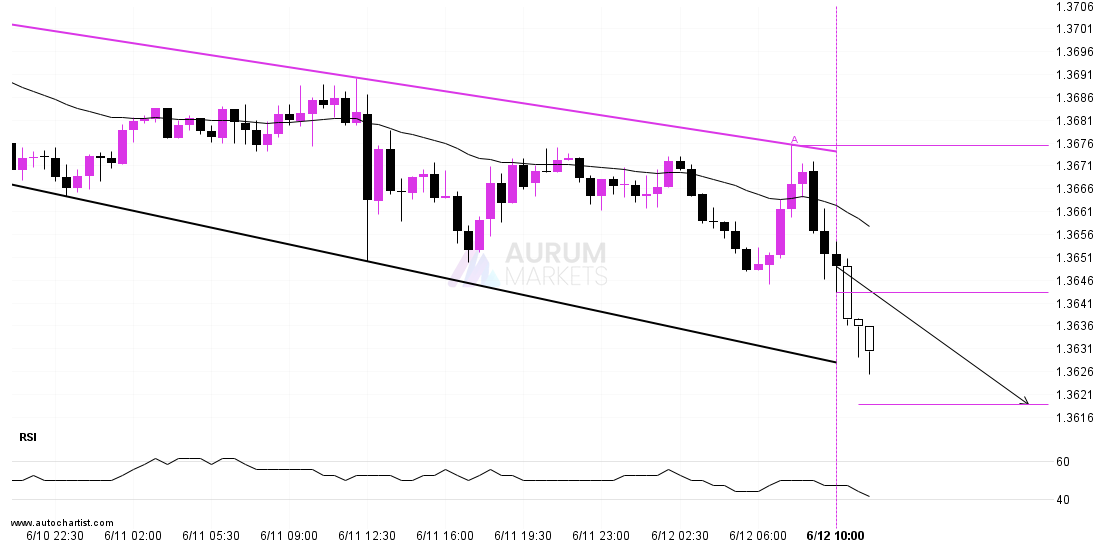
A Channel Down pattern was identified on USDCAD at 1.364325, creating an expectation that it may move to the support line at 1.3619. It may break through that line and
ASX 225 is en route to a very important line that will be a definite deciding factor of what is to come! We may see this trajectory continue to touch
Channel Up pattern identified on LTCUSD has broken through a support level with the price momentum continuing to move in an downward direction. A solid trading opportunity continues with the
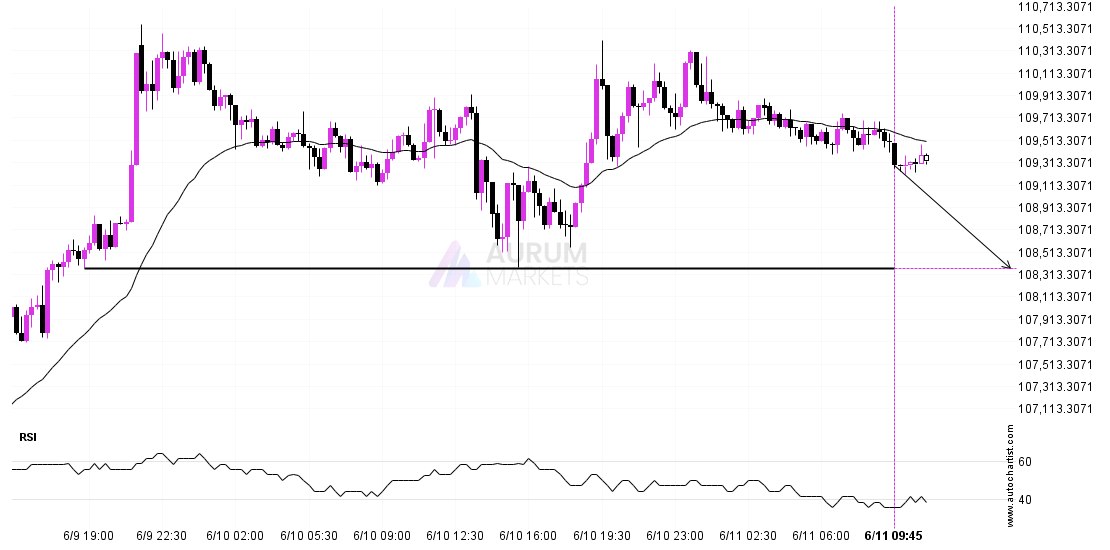
BTCUSD is moving towards a key support level at 108370.7500. BTCUSD has previously tested this level 3 times and on each occasion it has bounced back off this level. Is