ETHUSD approaching resistance levelETHUSD approaching resistance level
ETHUSD is heading towards a line of 2521.3000. If this movement continues, the price of ETHUSD could test 2521.3000 within the next 10 hours. But don’t be so quick to


ETHUSD is heading towards a line of 2521.3000. If this movement continues, the price of ETHUSD could test 2521.3000 within the next 10 hours. But don’t be so quick to
Emerging Channel Down pattern in its final wave was identified on the ASX 225 1 hour chart. After a strong bullish run, we find ASX 225 heading towards the upper
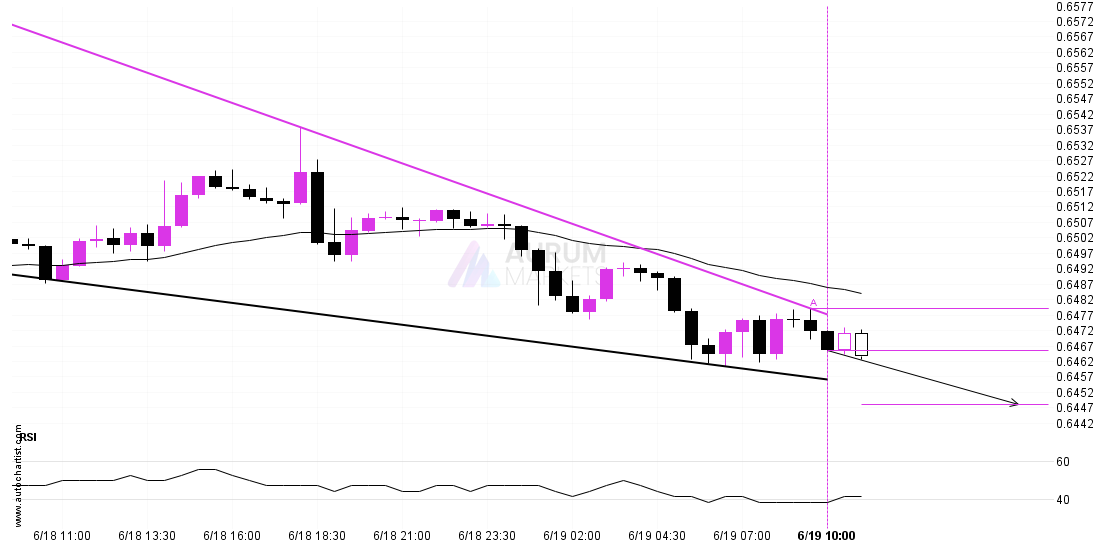
AUDUSD is heading towards the support line of a Falling Wedge and could reach this point within the next 6 hours. It has tested this line numerous times in the
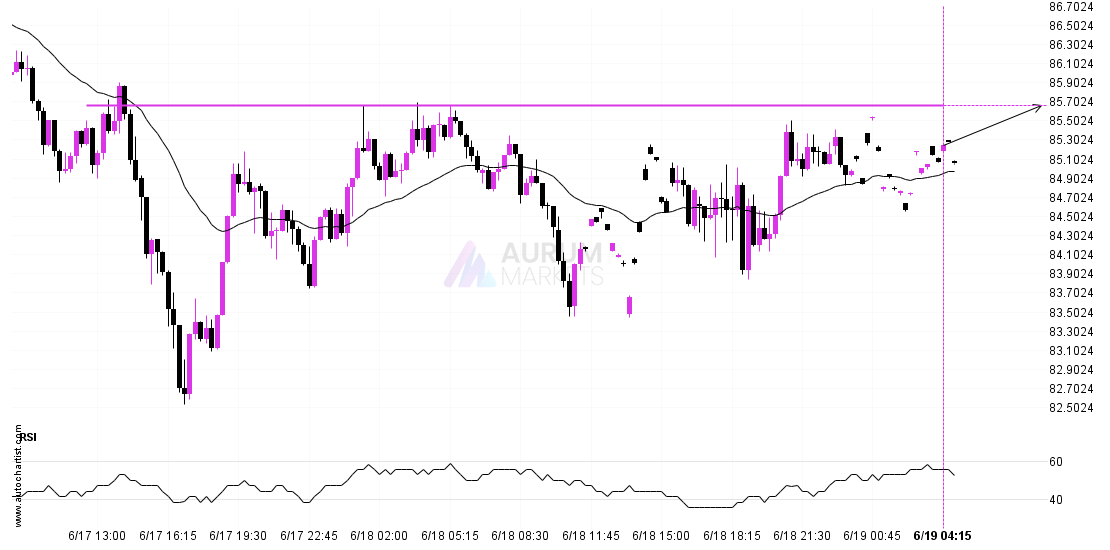
LTCUSD is about to retest a key horizontal resistance level near 85.6600. It has tested this level 5 times in the recent past and could simply bounce off like it
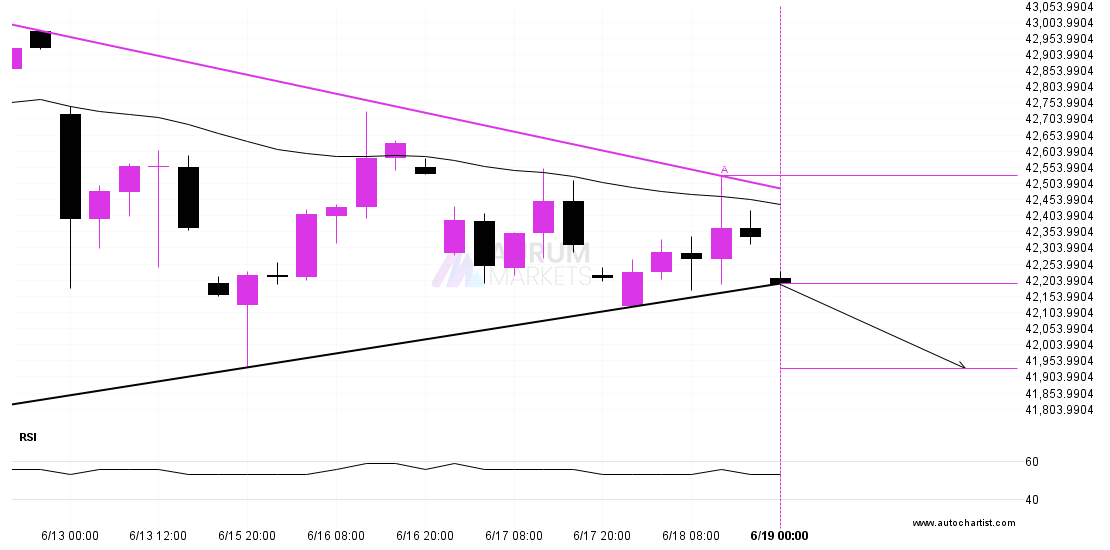
DOW 30 has broken through the support line which it has tested twice in the past. We have seen it retrace from this line before, so one should wait for
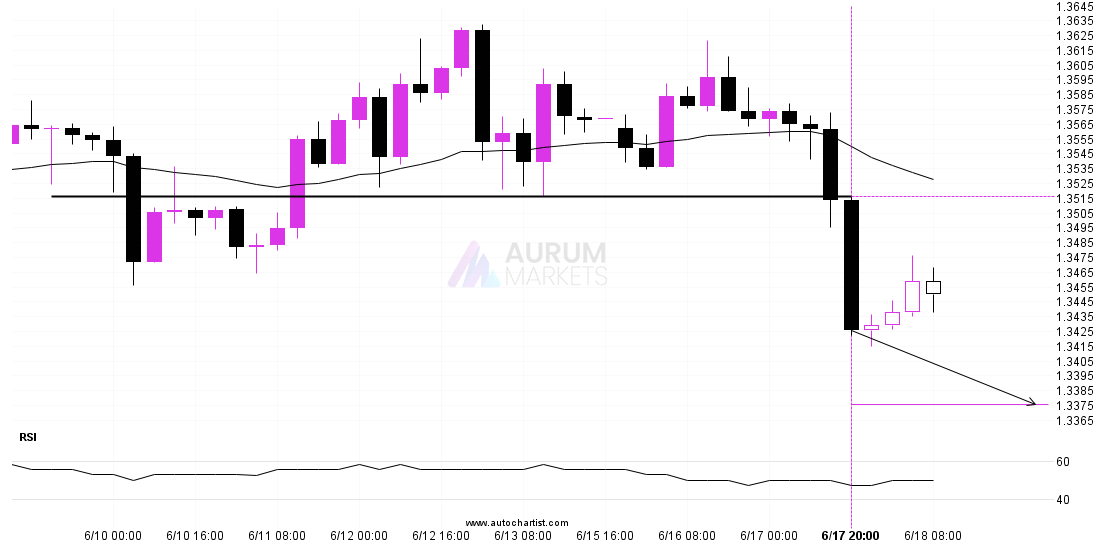
GBPUSD has breached the support line at 1.3516. It may continue the bearish trend towards 1.3376, or, it may prove to be yet another test of this level. Supported by
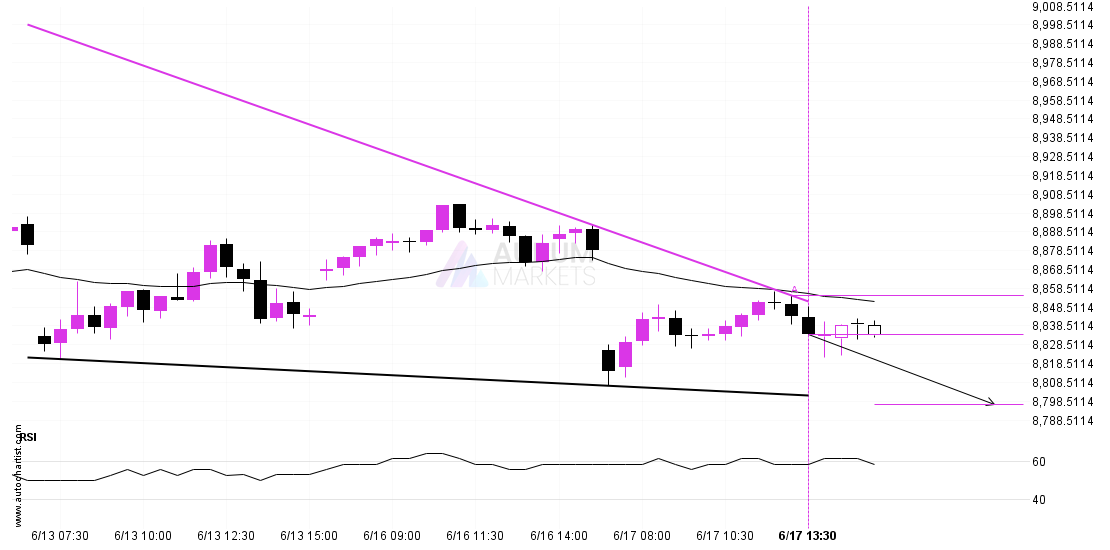
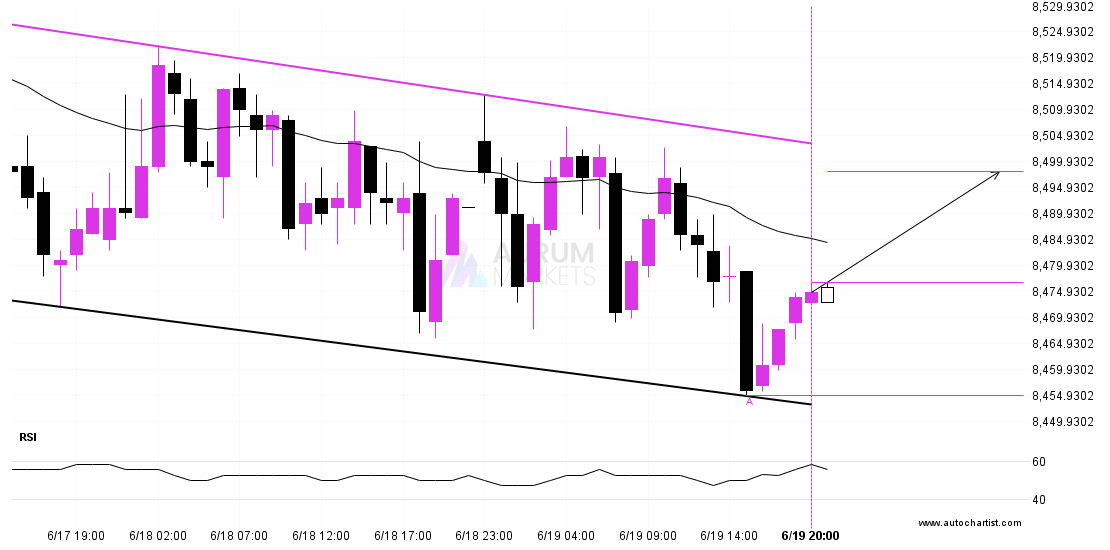
FTSE 100 is heading towards the support line of a Falling Wedge and could reach this point within the next 5 hours. It has tested this line numerous times in
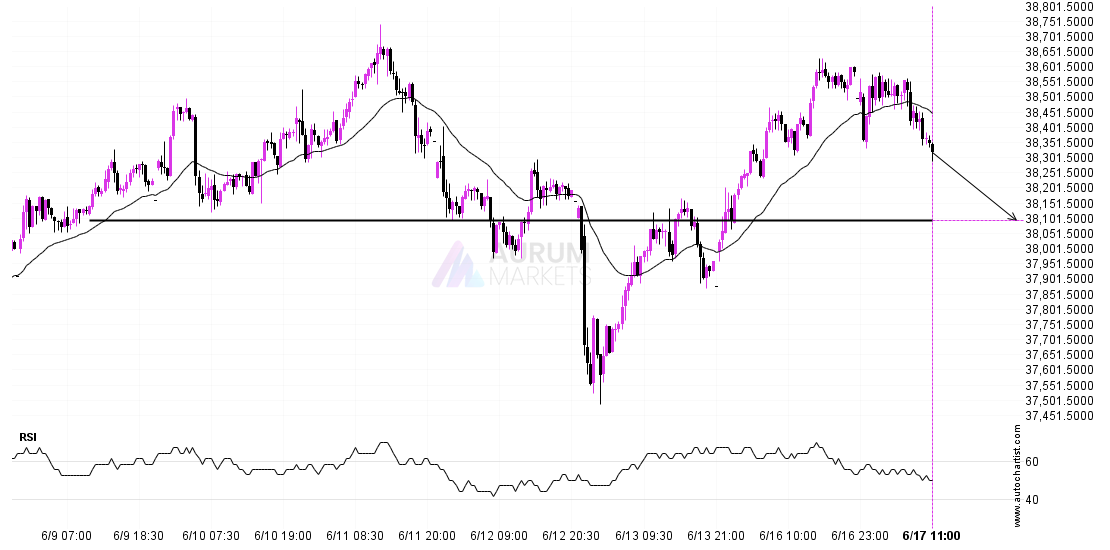
Nikkei 225 is moving towards a key support level at 38093.0000. This is a previously tested level for Nikkei 225. This could be a good trading opportunity, either at the
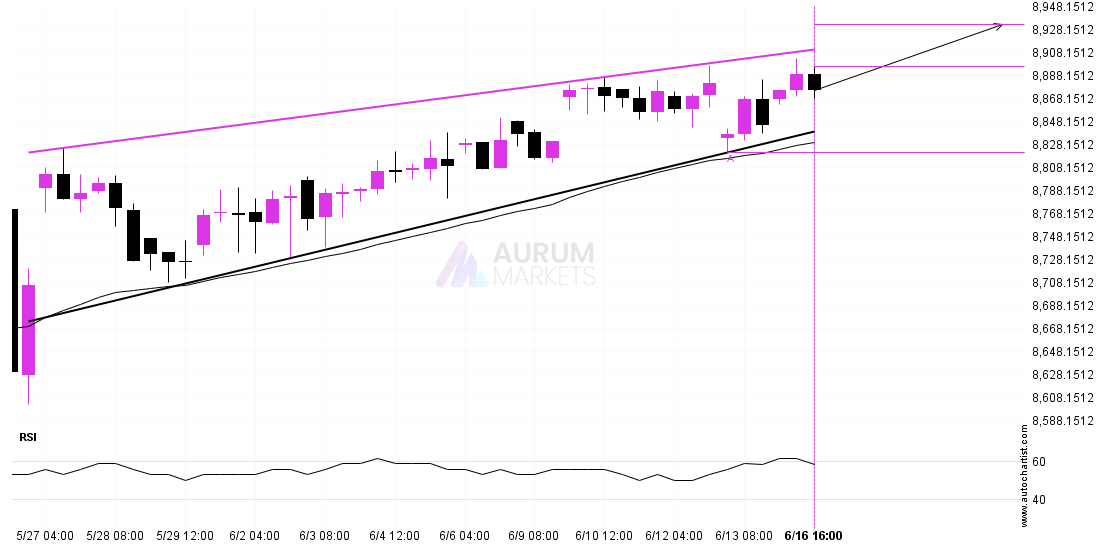
An emerging Rising Wedge has been detected on FTSE 100 on the 4 hour chart. There is a possible move towards 8931.7031 next few candles. Once reaching support it may

BTCUSD is once again retesting a key horizontal resistance level at 106573.0313. It has tested this level 8 times in the recent past and could simply bounce off like it