A final push possible on LTCUSDA final push possible on LTCUSD
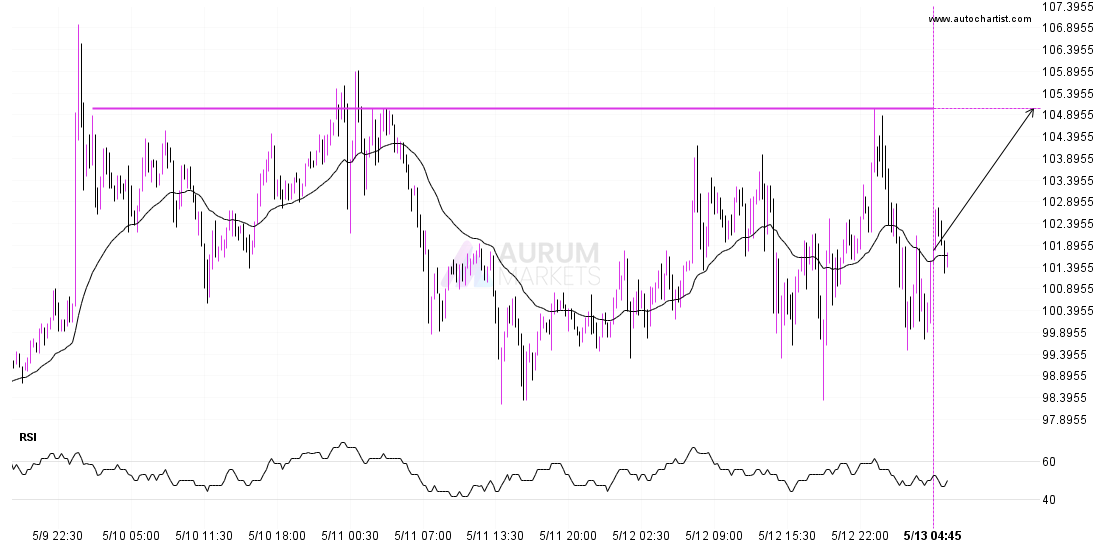
LTCUSD is approaching a resistance line at 105.0400. If it hits the resistance line, it may break through this level to continue the bullish trend, or it may turn around

LTCUSD is approaching a resistance line at 105.0400. If it hits the resistance line, it may break through this level to continue the bullish trend, or it may turn around
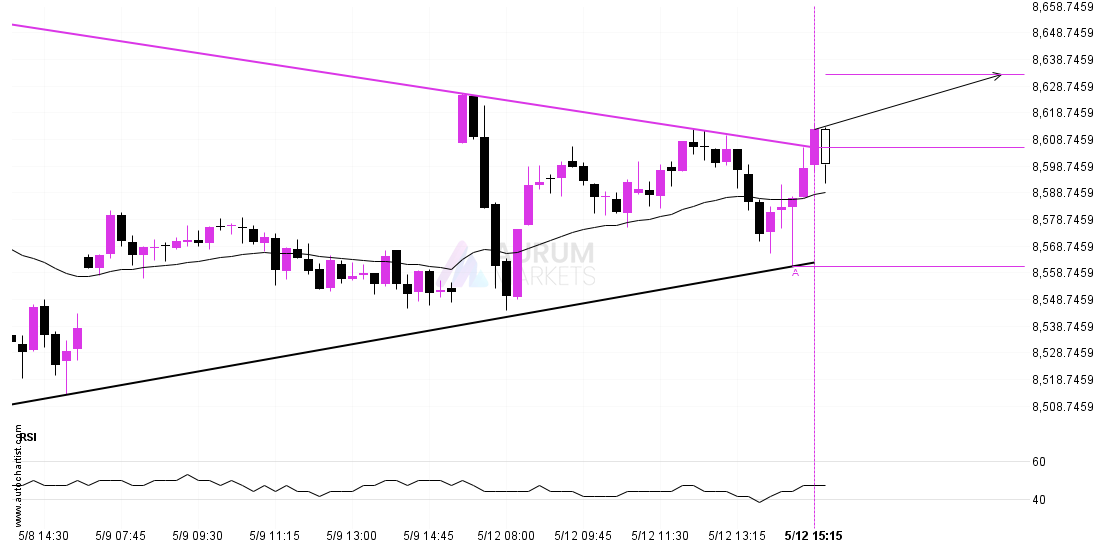
The last 5 15 Minutes candles on FTSE 100 formed a Triangle pattern and broken out through the pattern lines, indicating a possible bullish movement towards the price level of
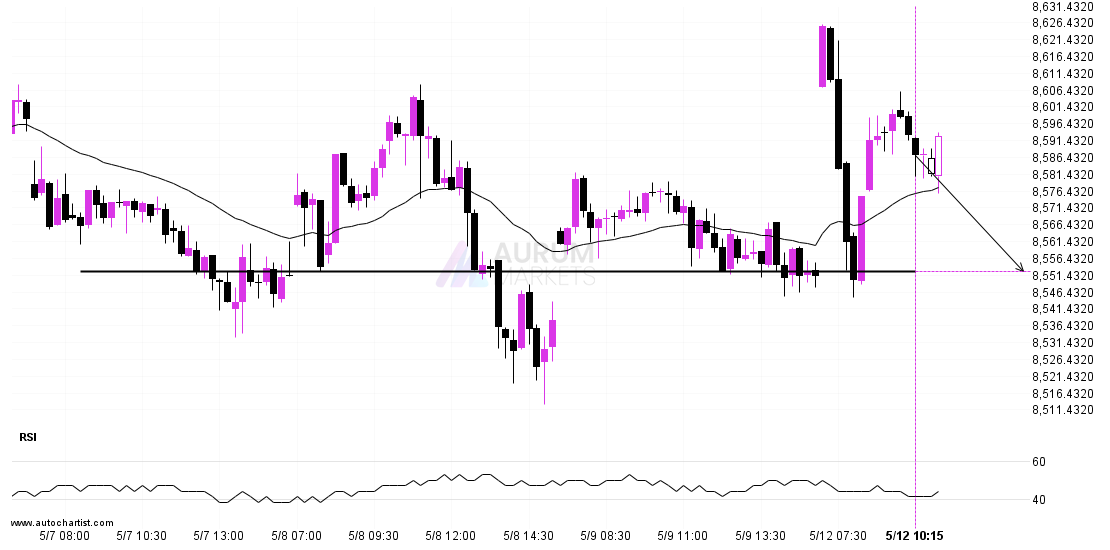
FTSE 100 is moving towards a key support level at 8552.5000. FTSE 100 has previously tested this level 3 times and on each occasion it has bounced back off this
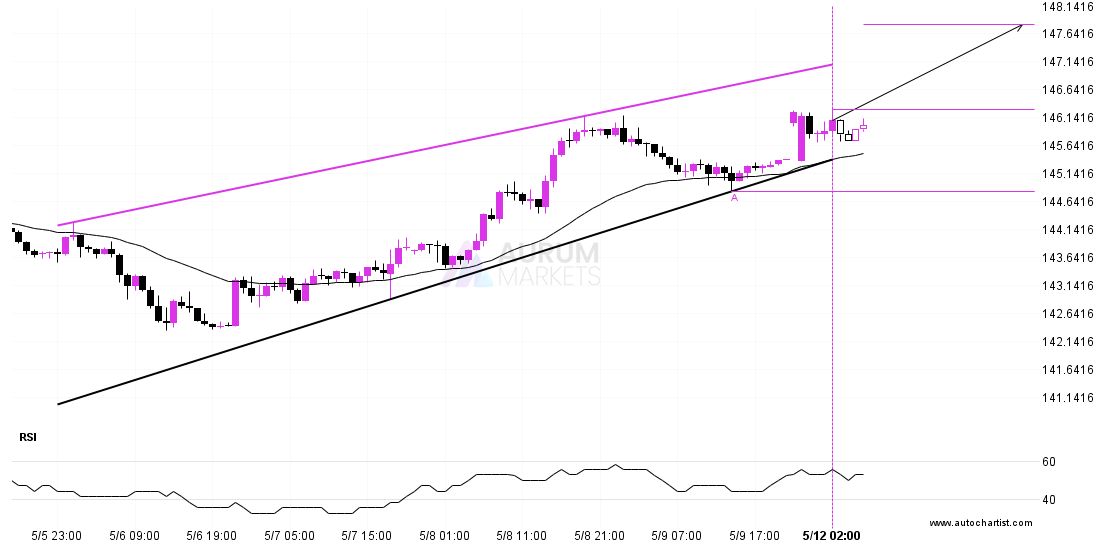
The movement of USDJPY towards the resistance line of a Rising Wedge is yet another test of the line it reached numerous times in the past. This line test could
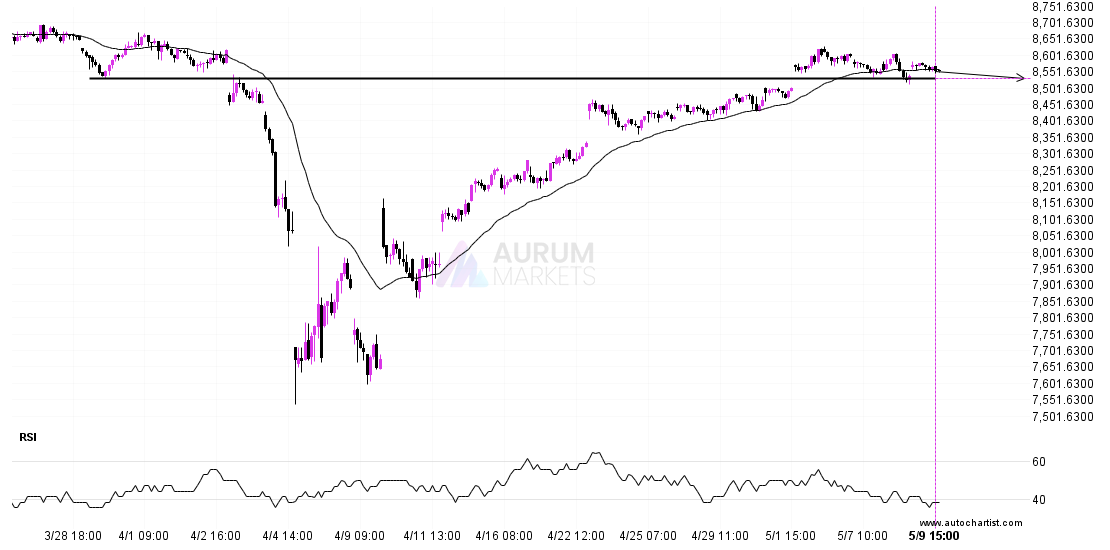
FTSE 100 is en route to a very important line that will be a definite deciding factor of what is to come! We may see this trajectory continue to touch
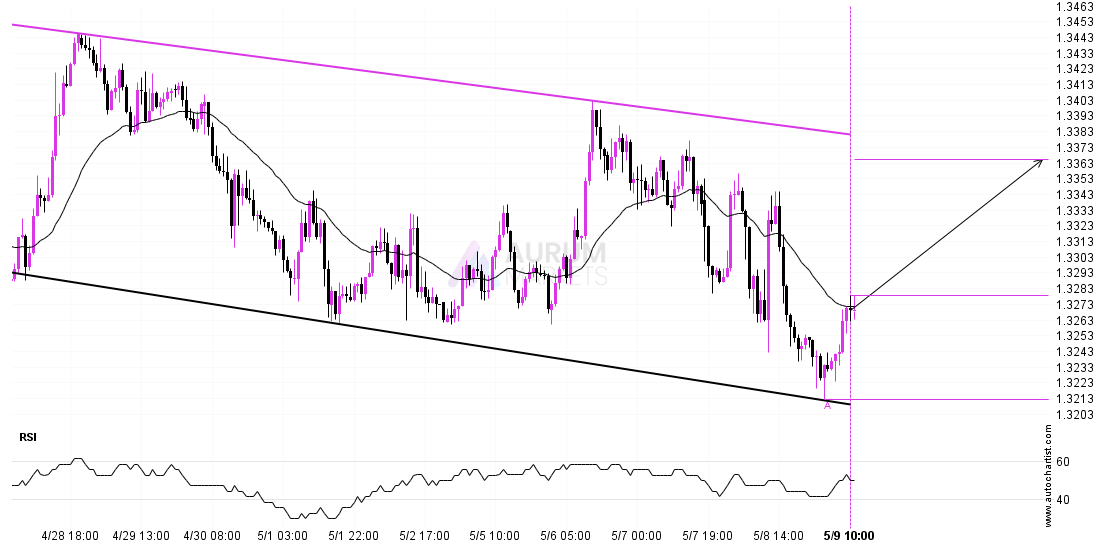
GBPUSD is approaching the resistance line of a Channel Down. It has touched this line numerous times in the last 15 days. If it tests this line again, it should
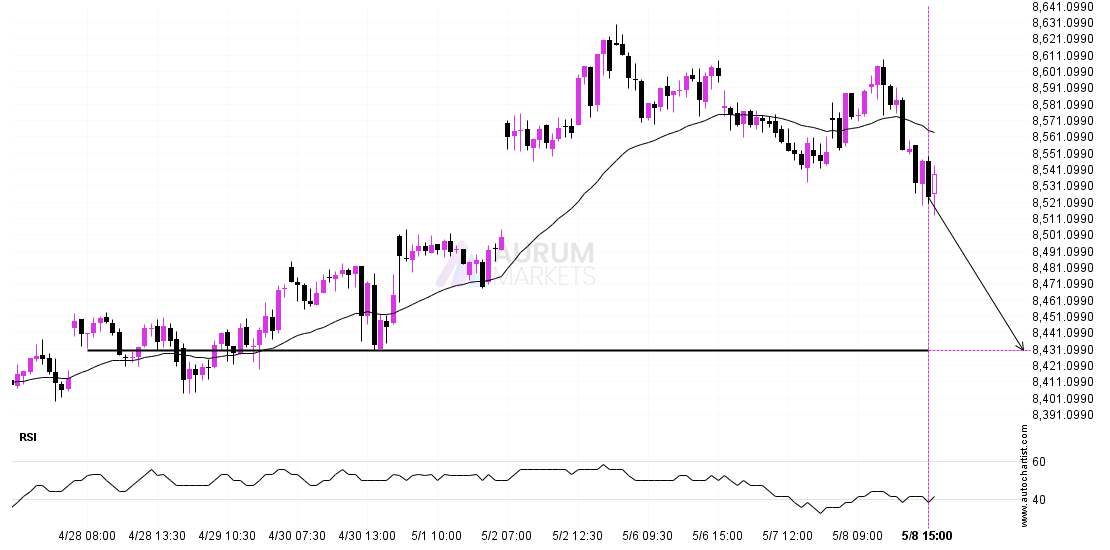
The movement of FTSE 100 towards 8430.2803 price line is yet another test of the line it reached numerous times in the past. We could expect this test to happen
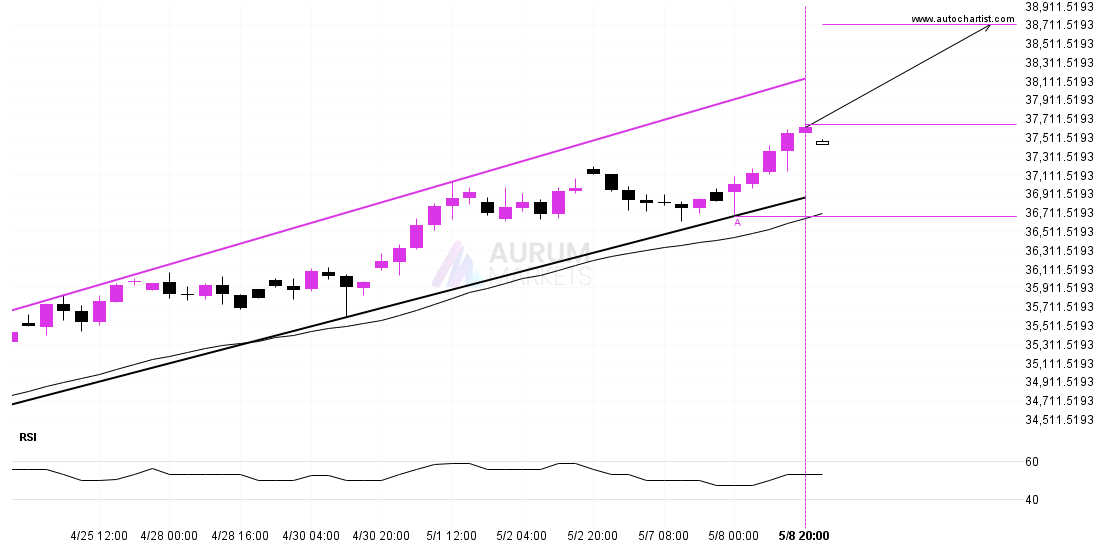
A Channel Up pattern was identified on Nikkei 225 at 37654.0, creating an expectation that it may move to the resistance line at 38709.7955. It may break through that line

DAX 40 has broken through a line of 23384.3008 and suggests a possible movement to 23564.3906 within the next 9 hours. It has tested this line numerous times in the
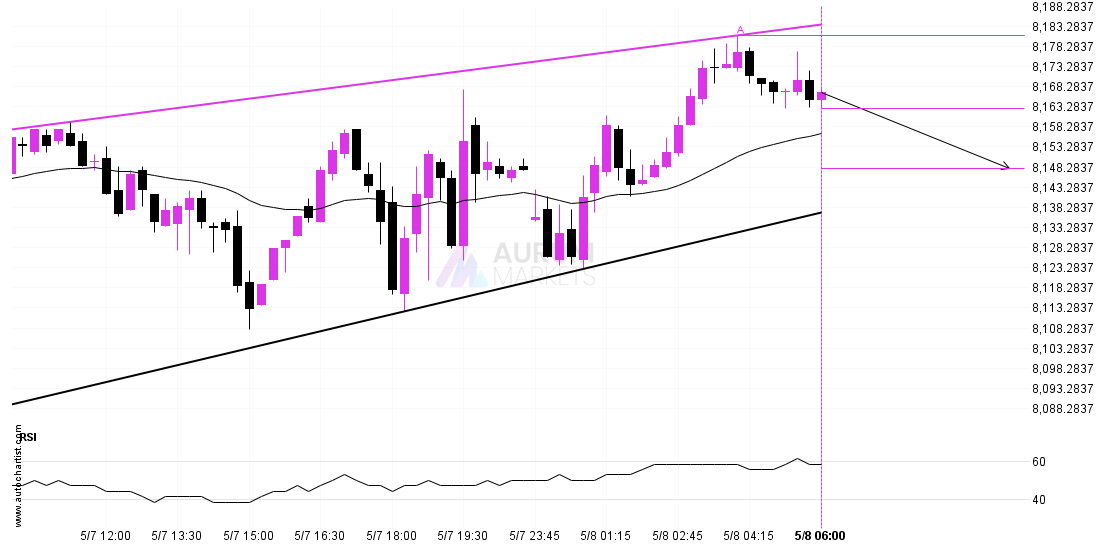
ASX 225 is heading towards the support line of a Rising Wedge. If this movement continues, the price of ASX 225 could test 8148.0250 within the next 5 hours. It