Resistance breakout on FTSE 100Resistance breakout on FTSE 100
FTSE 100 has broken through a resistance line. Because we have seen it retrace from this price in the past, one should wait for confirmation of the breakout before trading.

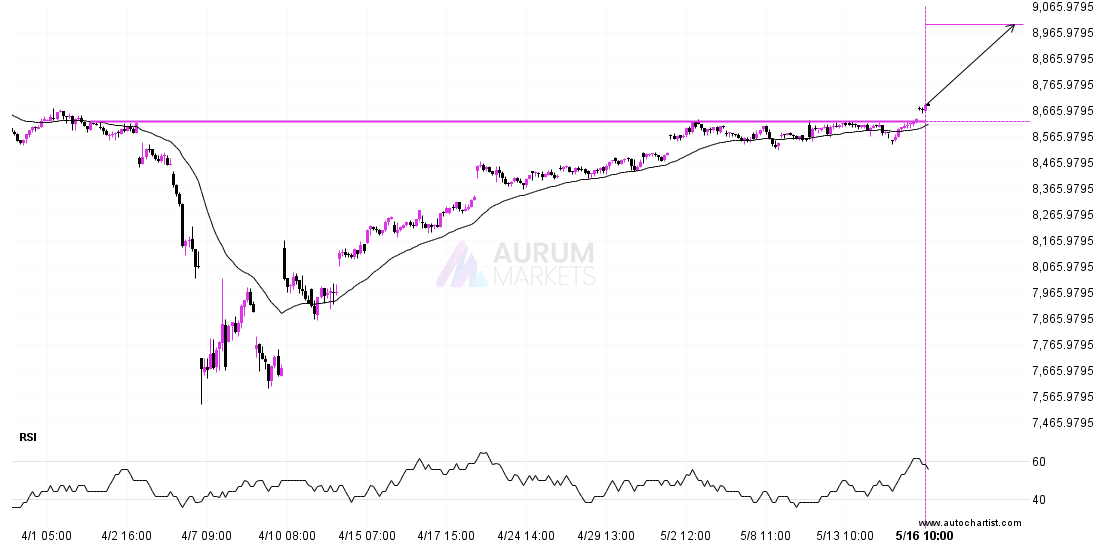
FTSE 100 has broken through a resistance line. Because we have seen it retrace from this price in the past, one should wait for confirmation of the breakout before trading.
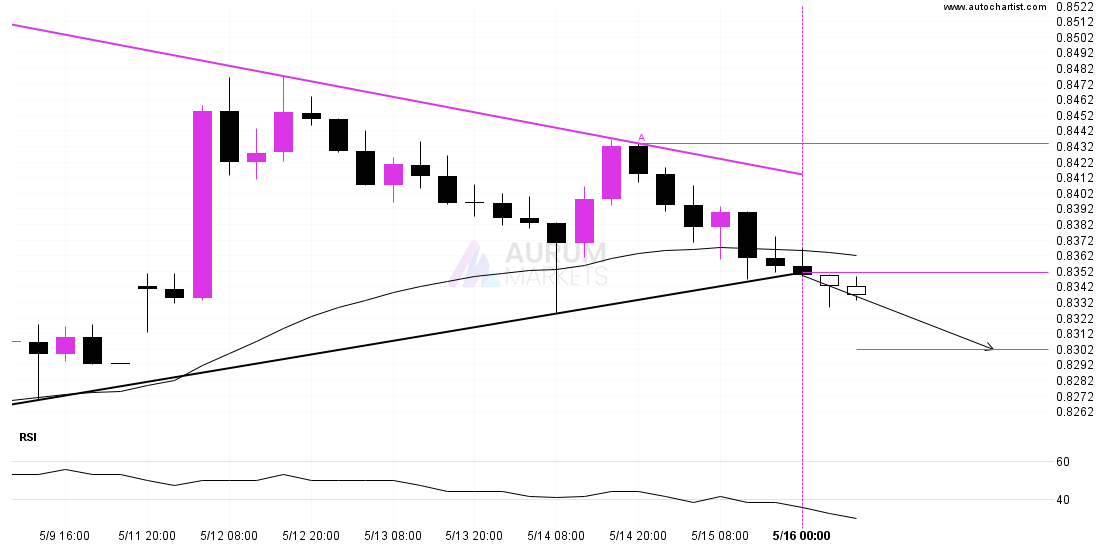
The breakout of USDCHF through the support line of a Triangle could be a sign of the road ahead. If this breakout persists, we may see the price of USDCHF
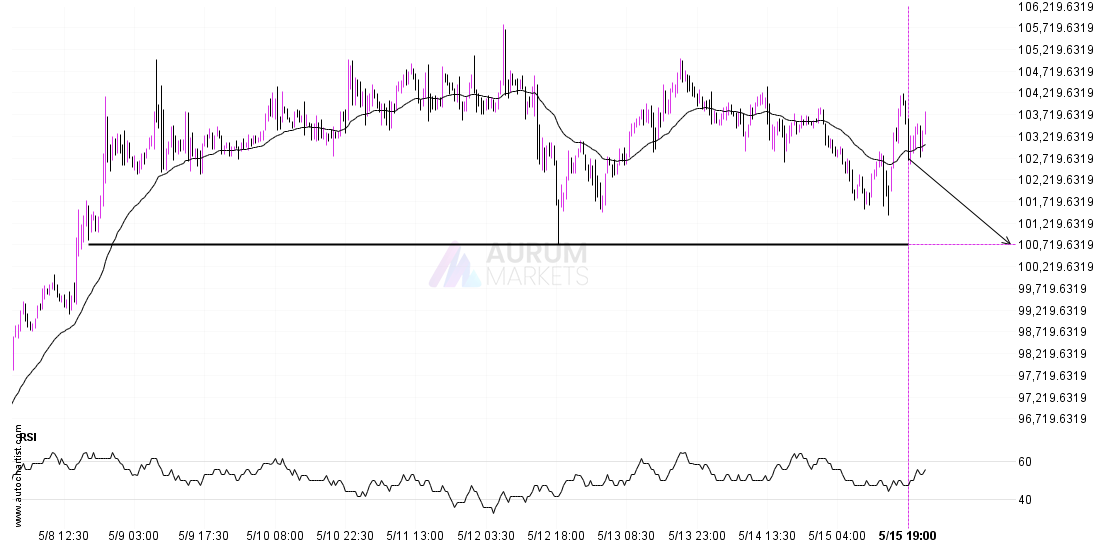
BTCUSD is en route to a very important line that will be a definite deciding factor of what is to come! We may see this trajectory continue to touch and
Nikkei 225 is moving towards a support line which it has tested numerous times in the past. We have seen it retrace from this line before, so at this stage
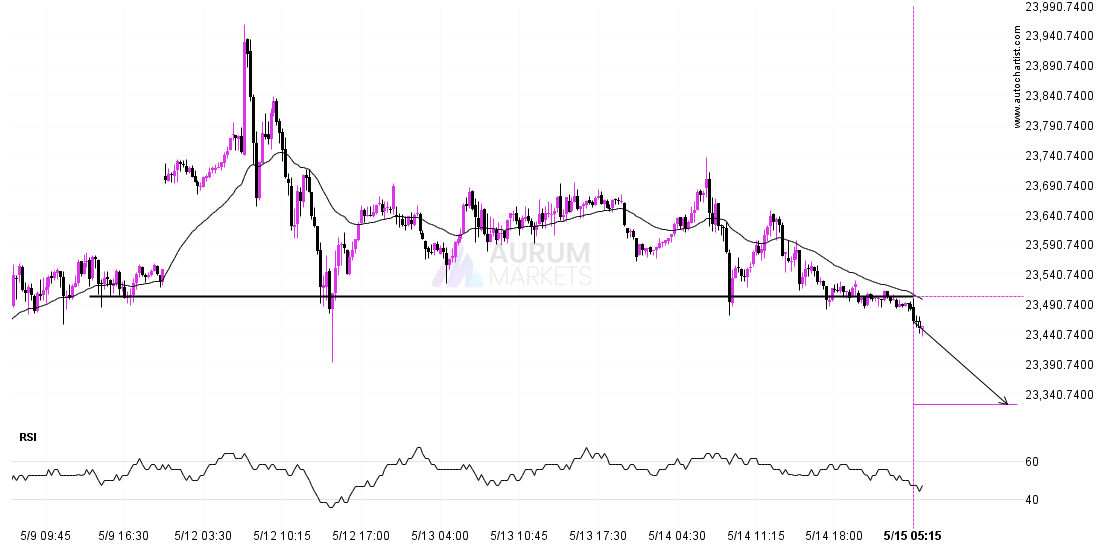
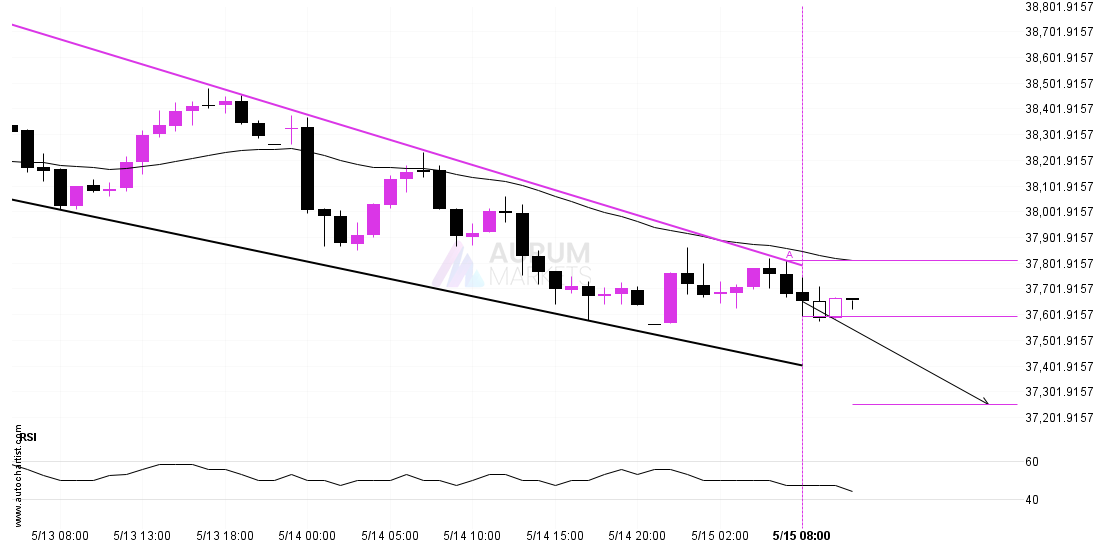
DAX 40 has broken through a line of 23503.6992 and suggests a possible movement to 23324.1992 within the next 16 hours. It has tested this line numerous times in the
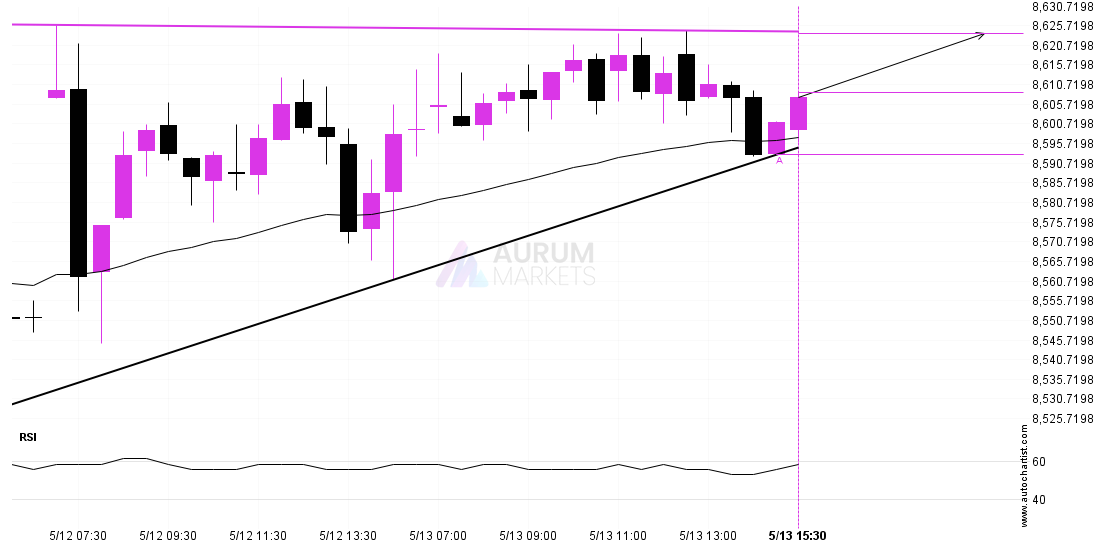
Emerging Triangle detected on BTCUSD – the pattern is an emerging one and has not yet broken through support, but the price is expected to move up over the next
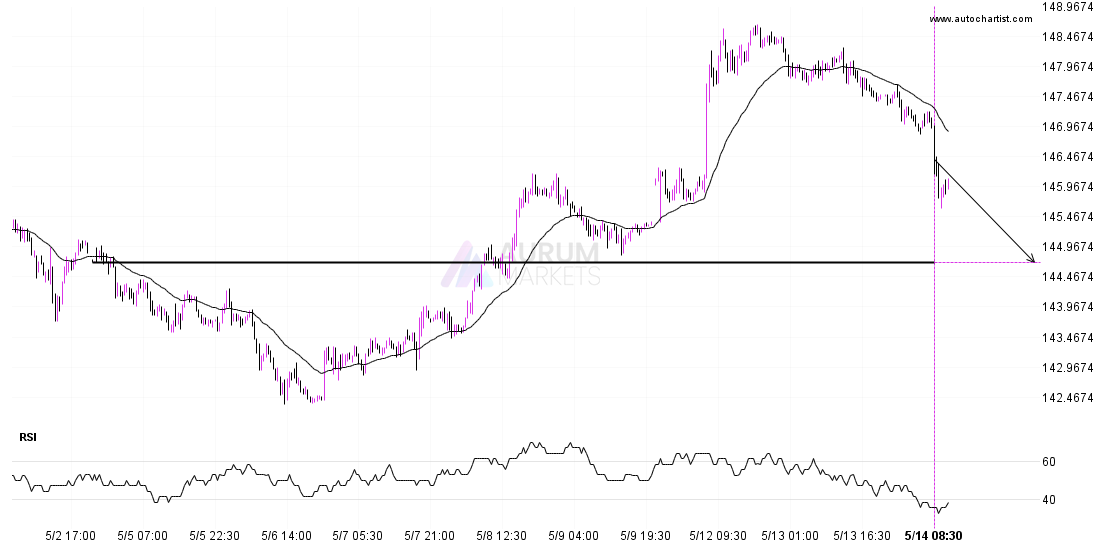
USDJPY is moving towards a key support level at 144.7020. USDJPY has previously tested this level 3 times and on each occasion it has bounced back off this level. Is
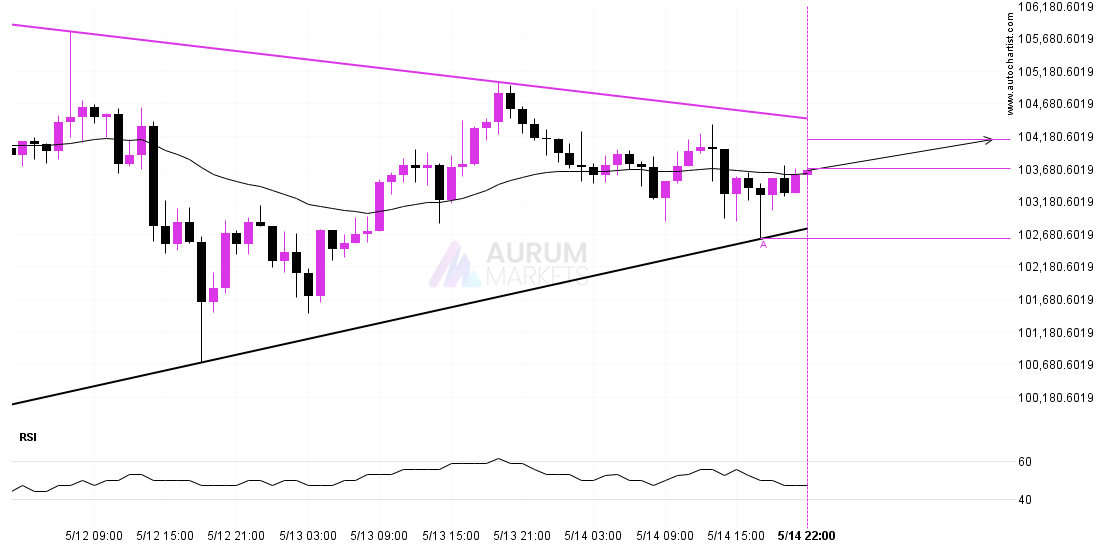
Emerging Ascending Triangle detected on FTSE 100 – the pattern is an emerging one and has not yet broken through support, but the price is expected to move up over
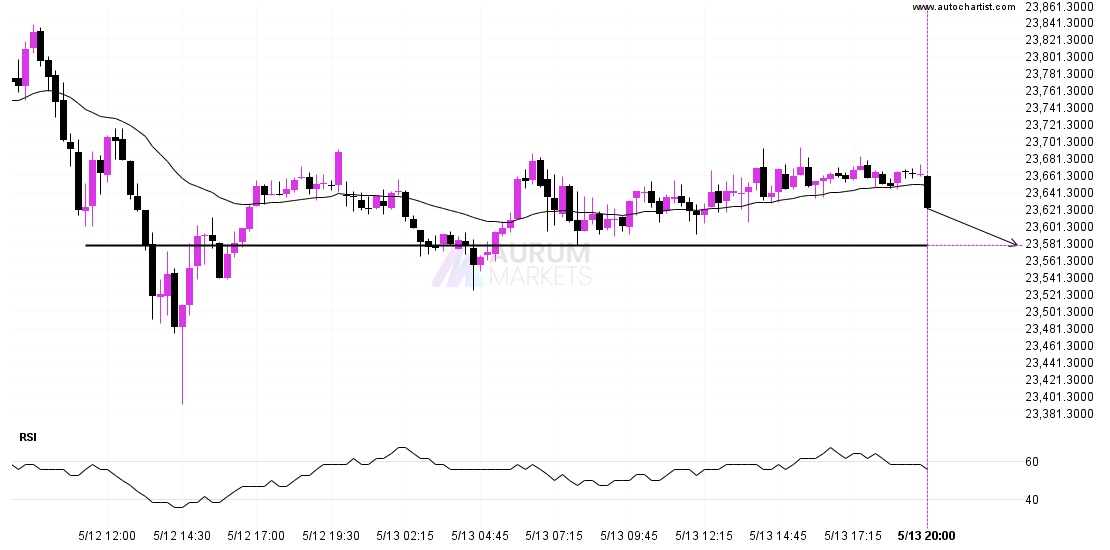
DAX 40 is approaching a support line at 23579.0000. If it hits the support line, it may break through this level to continue the bearish trend, or it may turn
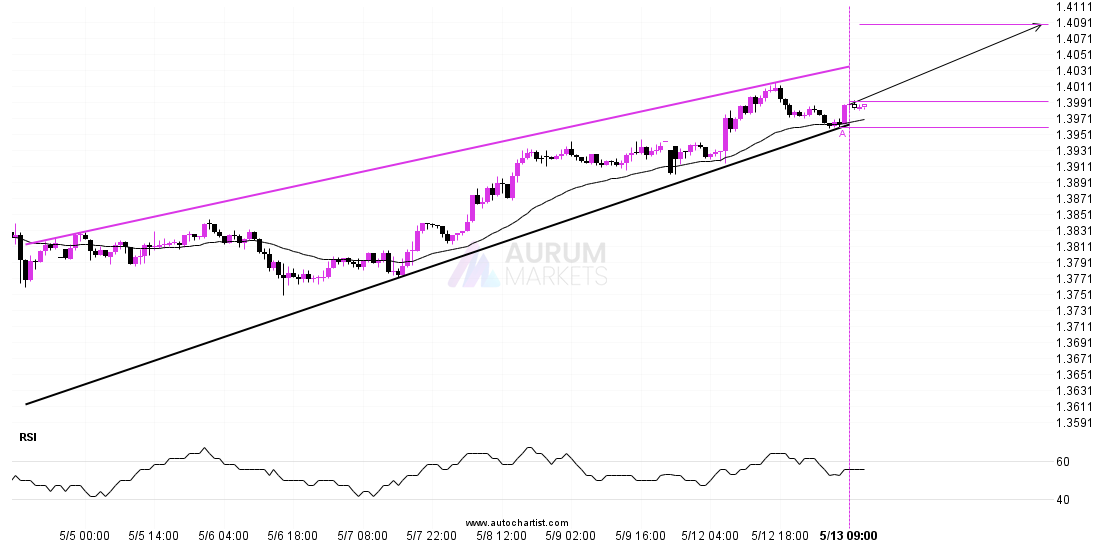
USDCAD is moving towards a resistance line which it has tested numerous times in the past. We have seen it retrace from this line before, so at this stage it